-
Notifications
You must be signed in to change notification settings - Fork 2
Entity Metric Graphs Report
Entity Metrics report shows graphs for all Metrics for Application, Tiers, Nodes, Business Transactions, Backends, Service Endpoints, Errors and Information Points for APM Applications.
The report graphs are only produced for Entities that had some metric activity (HasActivity=True in EntityMetrics report).
The sets of metrics are driven by EntityMetricsExtractMapping.csv. See Metric Sets for more information.
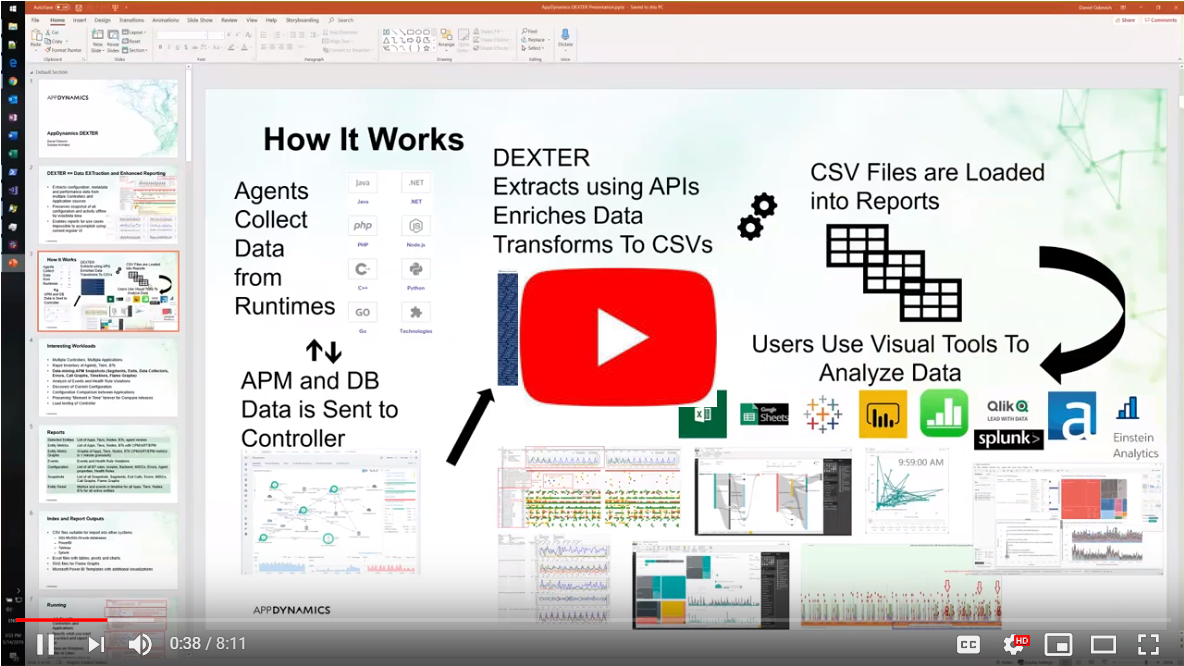
You can also watch this training video:
Entity Metric Graphs report is produced when:
- Job file included at least one APM application Target.Type=
APM - Metadata is extracted via Input.DetectedEntities=
true - Metrics are extracted via Input.Metrics=
true - Metrics are specified via Input.MetricsSelectionCriteria
- Report is requested via Output.EntityMetricGraphs=
true
Entity Metric Graphs report has the following file name:
Report\<Controller>\<Application>\<APP|TIER|NODE|BT|BACK|ERR|SEP|IP>\MetricGraphs.<APP|TIER|NODE|BT|BACK|ERR|SEP|IP>.<ControllerName>.<ApplicationName>.<EntityName>.<Start Date and Time>-<End Date and Time>.xlsx
For example:
APP\MetricGraphs.APP.demo1.appdynamics.com.ECommerce.66.2017111020-2017111022.xlsx
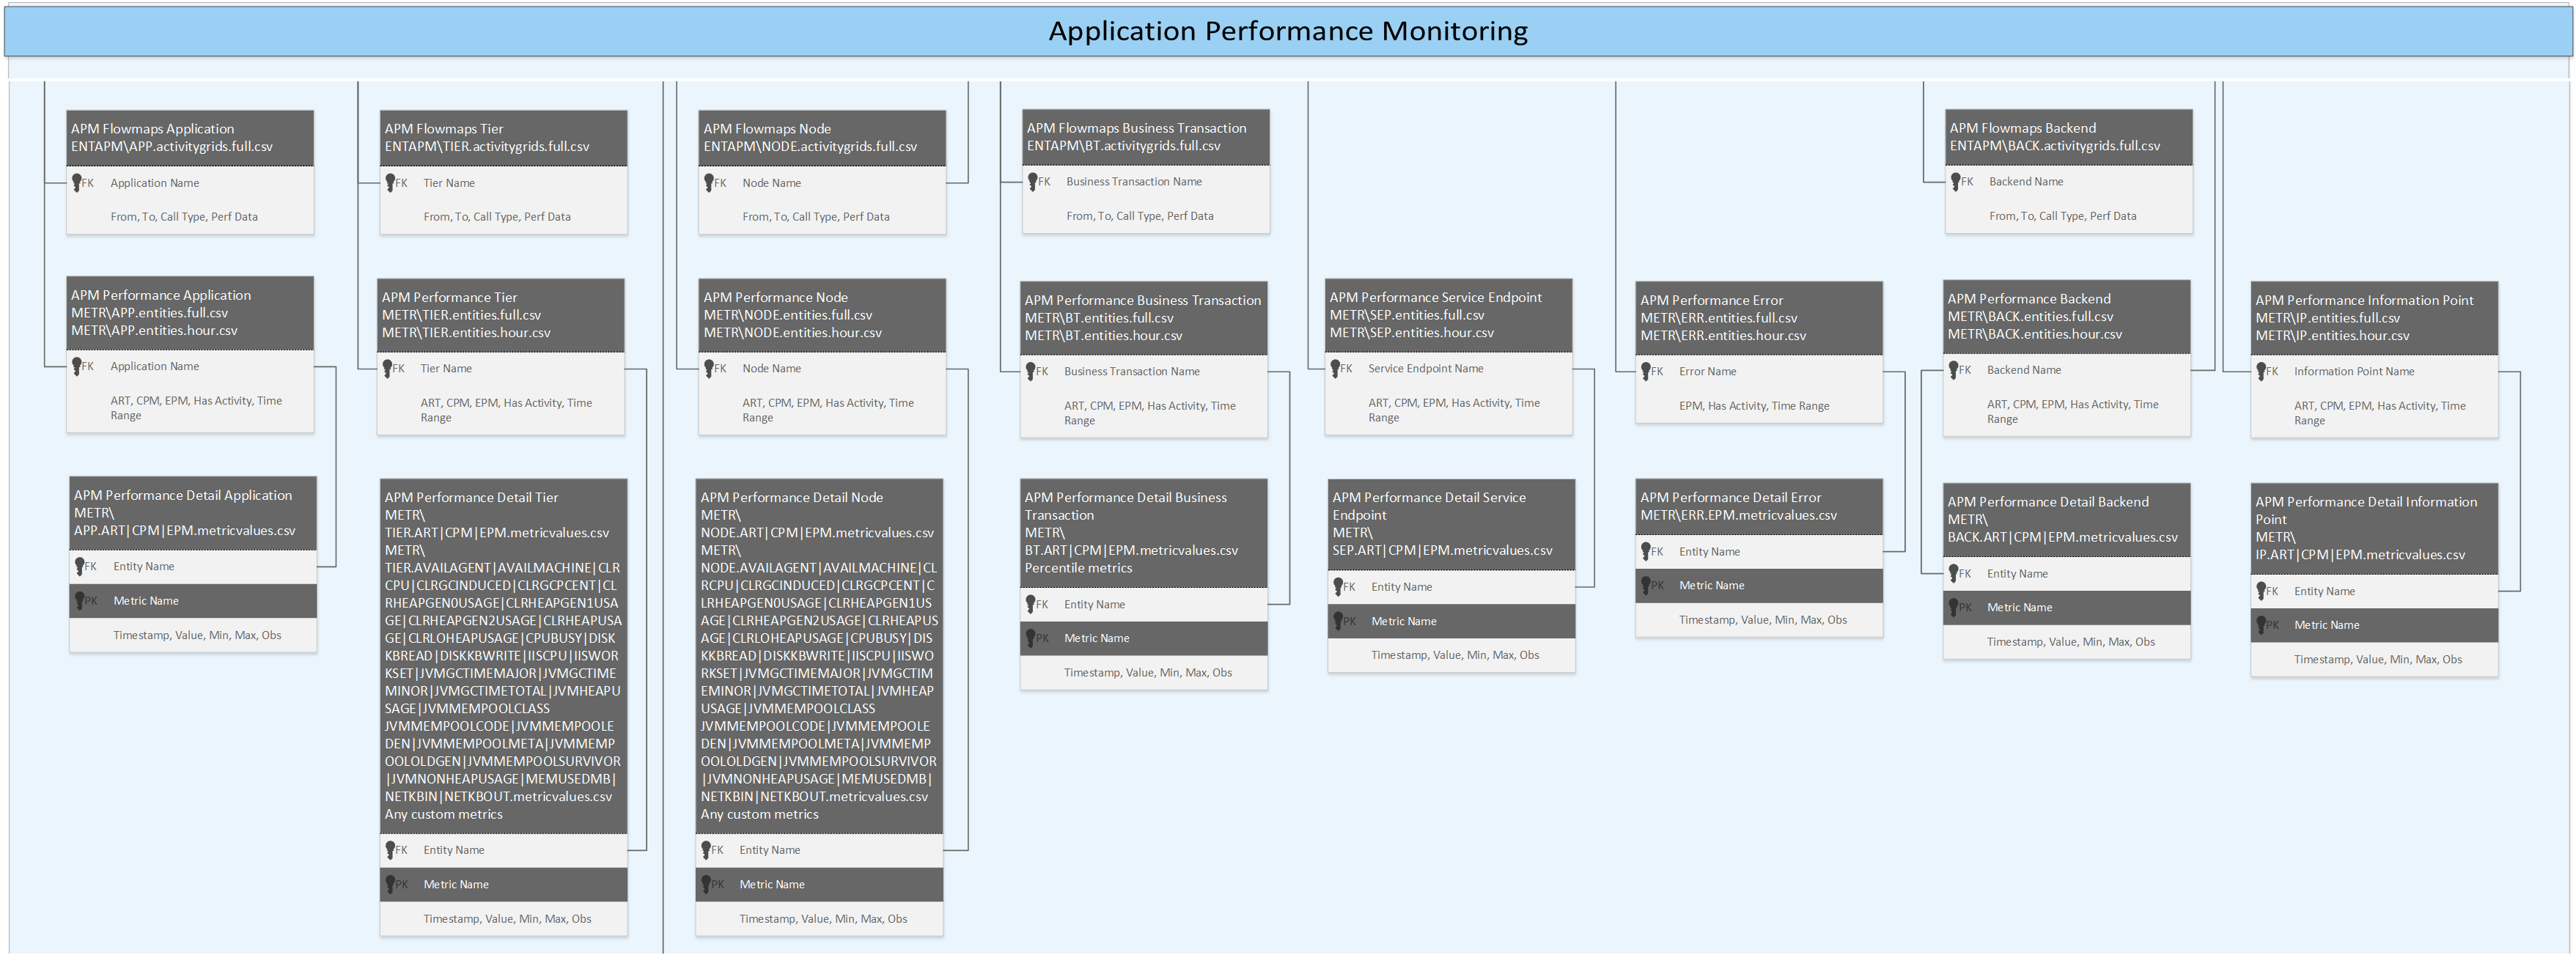
The data for the report is in the following files:
For APM Applications:
- Report\METRAPM\APP.<Metric Folder Name>.metricvalues.csv
- Report\METRAPM\TIER.<Metric Folder Name>.metricvalues.csv
- Report\METRAPM\NODE.<Metric Folder Name>.metricvalues.csv
- Report\METRAPM\BT.<Metric Folder Name>.metricvalues.csv
- Report\METRAPM\BACK.<Metric Folder Name>.metricvalues.csv
- Report\METRAPM\ERR.<Metric Folder Name>.metricvalues.csv
- Report\METRAPM\SEP.<Metric Folder Name>.metricvalues.csv
- Report\METRAPM\IP.<Metric Folder Name>.metricvalues.csv
- Report\METRAPM\IP.<Metric Folder Name>.metricvalues.csv
For SIM Machines:
- METRSIM\MACHINE.*.metricvalues.csv"
- METRSIM\NIC.*.metricvalues.csv"
For databases:
- Report\METRDB\STAT.*.metricvalues.csv
For BIQ metrics and business journeys:
- METRBIQ\BIZJOURN.*.metricvalues.csv
- SAVEDSRCH.BIQMETRALL.metricvalues.csv
For Web pages and ajax requests:
- METRWEB\PAGE.*.metricvalues.csv
- METRWEB\VIRTPAGE.*.metricvalues.csv
- METRWEB\WEBAPP.*.metricvalues.csv
- METRWEB\IFRAME.*.metricvalues.csv
For Network Requests:
- Report\METRMOBILE\MOBILEAPP.*.metricvalues.csv
- Report\METRMOBILE\NR.*.metricvalues.csv
| Data | Pivot |
|---|---|
| 1.Parameters | |
| 2.Contents | |
| 3.Controllers | |
| <Entity Type> Graphs | |
| <Entity Type>Calls Scatter | |
| Entity Metrics |
This sheet describes the parameters of the extraction and reporting job that produced this report.
| Column | Data Type | Purpose |
|---|---|---|
| Controller | URL | Controller that was queried |
| UserName | String | User that was used to retrieve data from the Controller |
| Application | String | Name of Application that was queried |
| ApplicationID | Integer | ID of Application in Controller |
| ApplicationType | String | Type of the Application |
This sheet provides quick access to the contents of this report and provides at-a-glance number of rows in each of the sheet's tables.
| Column | Data Type | Purpose |
|---|---|---|
| Sheet Name | String | Name of the sheet in the report |
| Num Entities | Integer | Number of Entities in that sheet |
| Link | Hyperlink | Link to the sheet in the report |
This sheet provides information about Controllers covered by this report.
| Column | Data Type | Purpose |
|---|---|---|
| Controller | URL | Controller that was queried |
| Version | String | Version of the Controller |
| VersionDetail | String | Full version string of the Controller |
| NumApps | Integer | Number of all APM Applications registered in the Controller |
| NumAPMApps | Integer | Number of APM Applications registered in the Controller |
| NumWEBApps | Integer | Number of WEB Applications registered in the Controller |
| NumMOBILEApps | Integer | Number of MOBILE Applications registered in the Controller |
| NumIOTApps | Integer | Number of IoT Applications registered in the Controller |
| NumSIMApps | Integer | Number of SIM Applications registered in the Controller |
| NumBIQApps | Integer | Number of BIQ Applications registered in the Controller |
| NumDBApps | Integer | Number of DB Applications registered in the Controller |
| ControllerLink | URL | Link to Controller |
This sheet provides consolidated view of all Metrics available for this Entity for this metric Graph. Each Graph defined in the EntityMetricsExtractMapping.csv is on a separate sheet
Each Entity that had activity has a series of rows.
Each hour range is represented with the graph with the relevant metrics.
It is possible to see other graphs, like on this JVM GC graph for Nodes:
This sheet provides ART vs CPM and ART vs EPM scatter plots using Metrics available for this Entity
Each Entity that had activity has a series of rows.
Each hour range is represented with the graph with the relevant metrics.
All data for the metric graphs specified in the mapping file is stored in this sheet.
- Home
- Getting Started Walkthrough
- Run
-
Excel Reports
- Detected APM Entities
- Detected SIM Entities
- Detected DB Entities
- Detected WEB Entities
- Detected MOBILE Entities
- Detected BIQ Entities
- Entity Metrics
- Entity Metric Graphs
- Registered APM Metrics
- Entity Flowmaps
- Configuration
- Events and Health Rule Violations
- Entity Details
- Snapshots
- Snapshot Method Calls
- Individual Snapshot
- Users and Permissions
- Dashboards
- Health Check
- PowerBI Reports
- Tableau Reports
- Browser Reports


