-
Notifications
You must be signed in to change notification settings - Fork 11.9k
New issue
Have a question about this project? Sign up for a free GitHub account to open an issue and contact its maintainers and the community.
By clicking “Sign up for GitHub”, you agree to our terms of service and privacy statement. We’ll occasionally send you account related emails.
Already on GitHub? Sign in to your account
Improve the rendering of negative values in the bar chart. #994
Conversation
… all values are negative, draw down from the top. Updated the sample file to allow for negative bars.
|
It's a must ! Great and clean PR. +1 to merge. @etimberg In first case (both negative and positive values), what about highlighting |
|
@fntneves sounds like a good idea. I'll look into adding it. |
|
fantastic - love your work! |
|
+1, only thing i can see as not quite right is in the one where it is both negative and positive the fill doesn't quite go down to the 0 line on the positive and goes over the line on the negative. I think this can be fixed by also adding |
|
Notice, |
|
Hi, thank you for the fix. However, like markomarkovic said, it's not working on IE due to "math.sign" compatibility. Is there an alternative way to have this working ? The use of IE is mandatory on my project... |
|
@kfeine-FR I've successfully used this polyfil on Android. It should work for other platforms too. |
|
@markomarkovic @kfeine-FR I've updated this PR to remove the dependency on Math.sign @leighquince I've taken your suggestion to move the base point down. |
|
Closing since this has been incorporated into v2.0 |
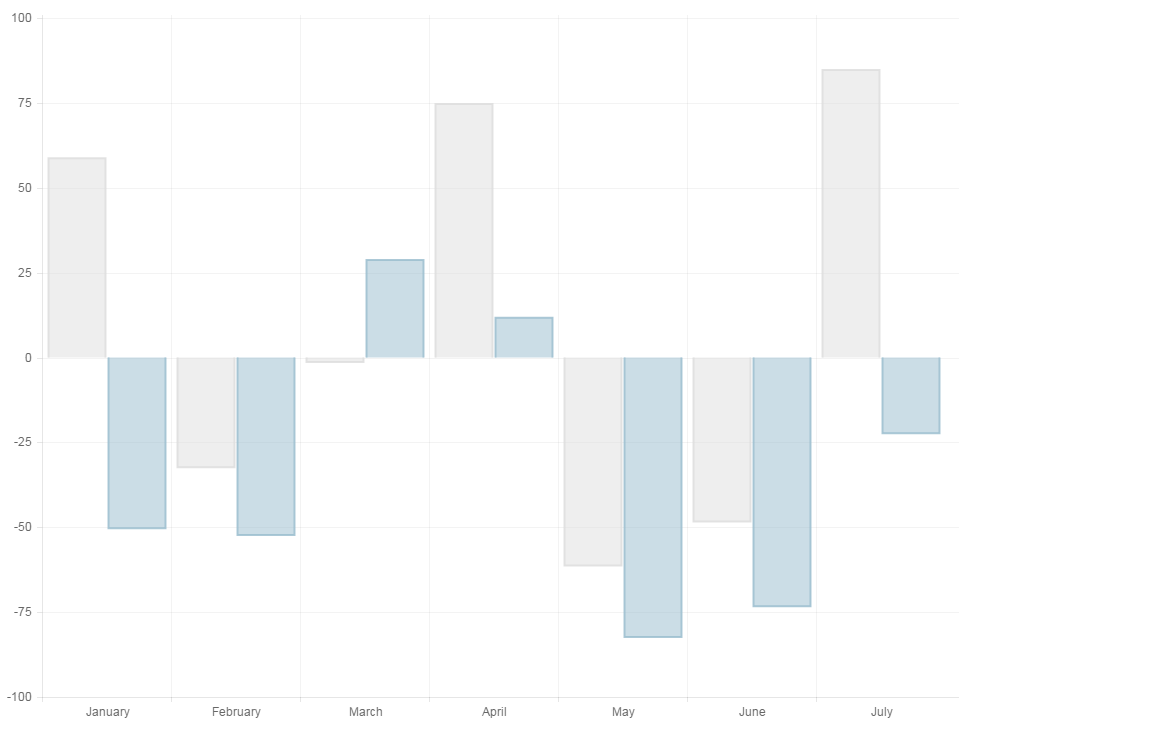
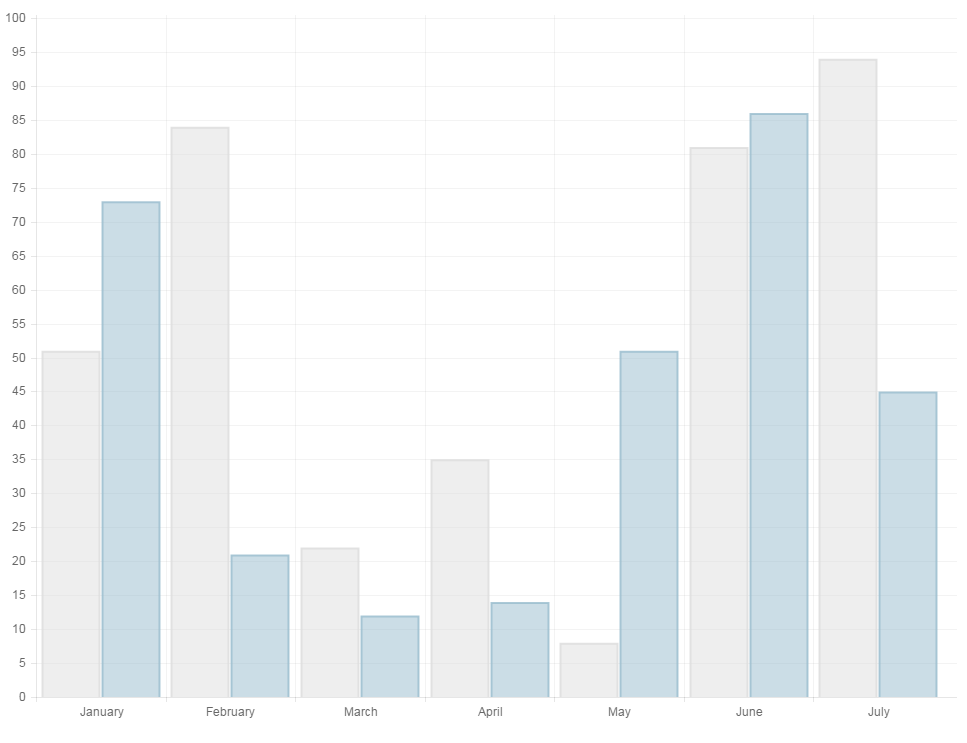
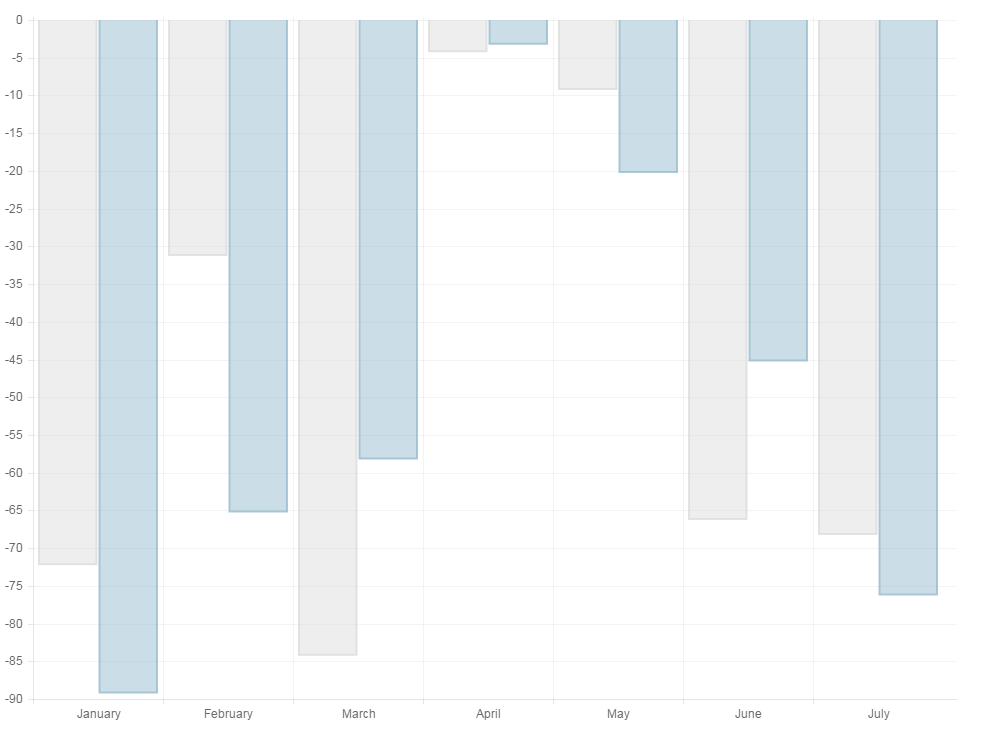
Inspired by #669, this is a fix for #9. Changed the bar chart drawing so that negative bars are drawn downwards. The animations are changed so that bars flow outward from the base towards the final value in all cases. If the scale has a
0point, the animations flow from here. I updated the sample file to include both positive and negative values.When both positive and negative values exist, the chart draws as such:

When only positive values exist, the chart draws like this:

When only negative values exist, the chart draws like this:
