-
Notifications
You must be signed in to change notification settings - Fork 1.3k
New issue
Have a question about this project? Sign up for a free GitHub account to open an issue and contact its maintainers and the community.
By clicking “Sign up for GitHub”, you agree to our terms of service and privacy statement. We’ll occasionally send you account related emails.
Already on GitHub? Sign in to your account
Move BSQ dashboard into separate Facts & Figures section #2513
Move BSQ dashboard into separate Facts & Figures section #2513
Conversation
|
Maybe tab should move right to governance and be called more generic. Ecosystem maybe? Would be nice to have 2 buttons left:
|
|
@ben-kaufman If you like you could join forces here as well ;-) |
|
@ManfredKarrer I'll take a look on that :) |
The reason why I would have it on the left is that it would open as the default tab when someone clicks on the DAO section. It should be in the end a dashboard with nice graphs and a high-level visualization of the DAO. Otherwise it would be the BSQ Send screen. To find the right term for this section:
Maybe we could also label it I was thinking about having in the final version two sub-sections:
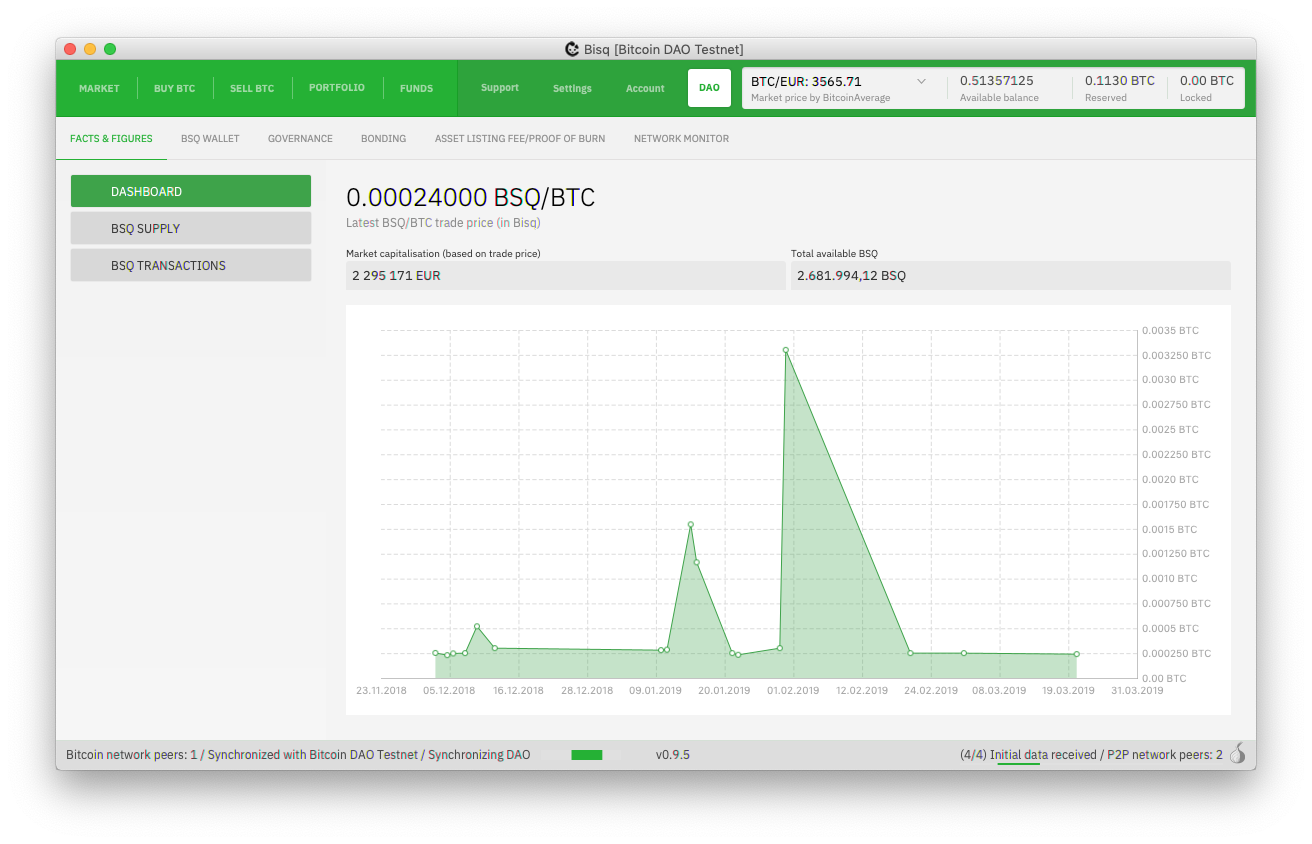
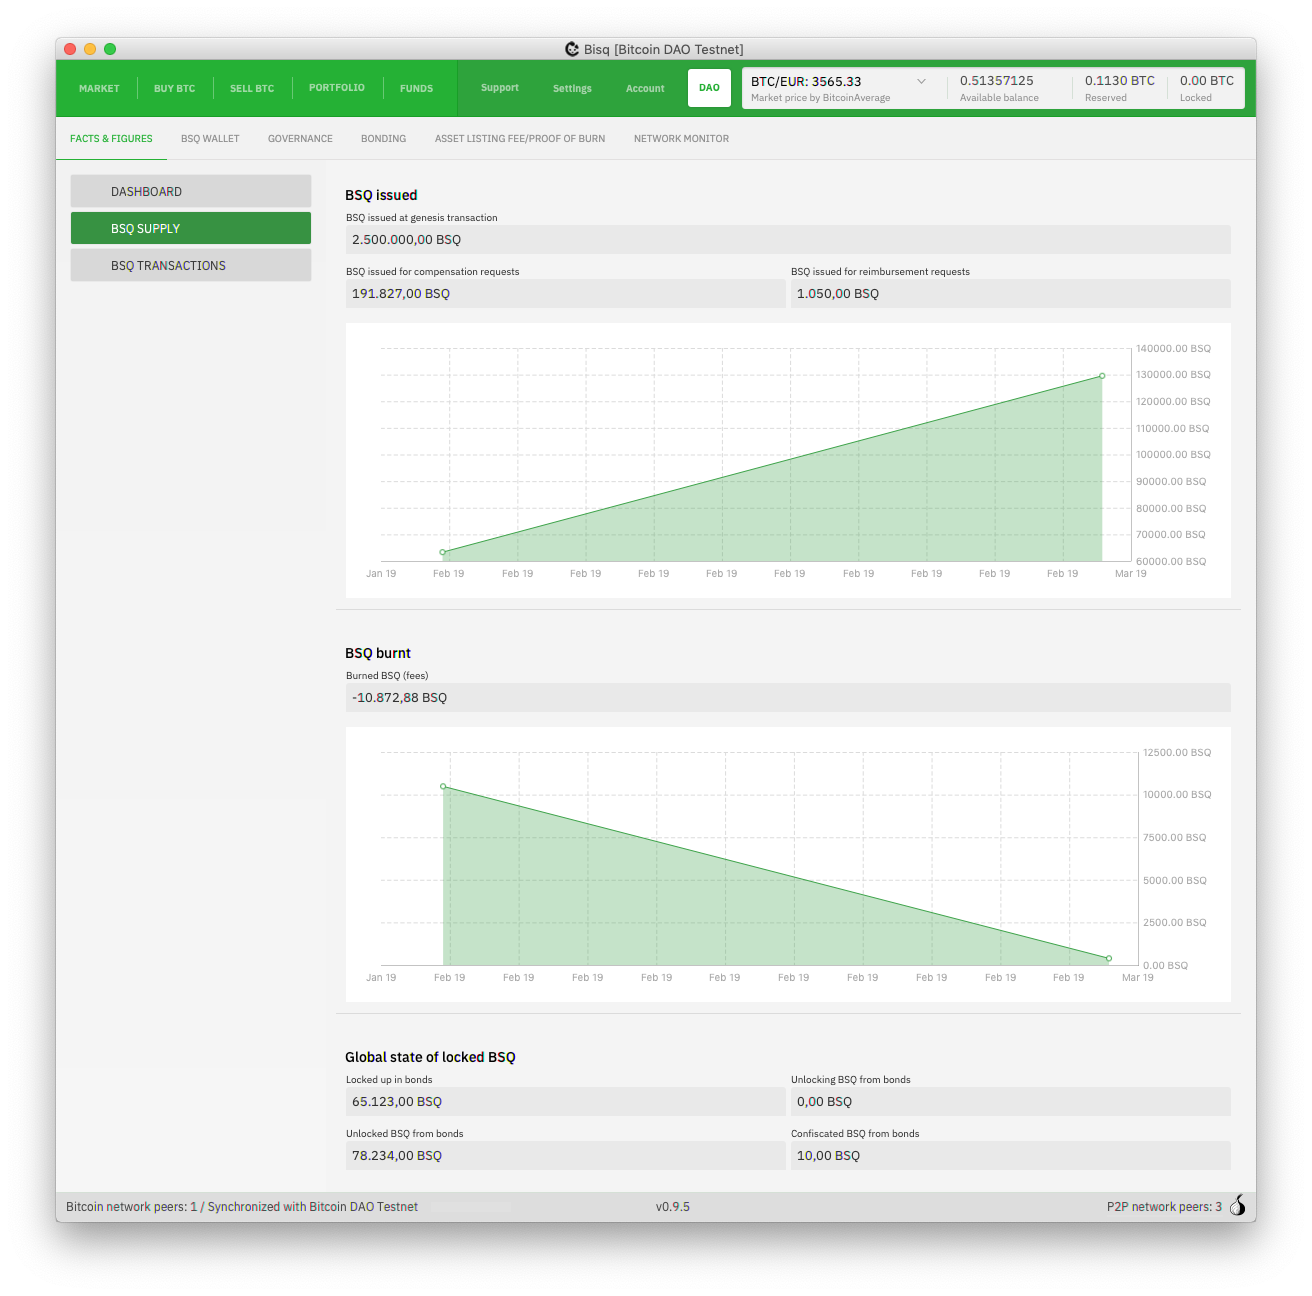
In general in the DAO > Facts and Figures > Dashboard should give the user an overview on the amount of BSQ available over time (BSQ colored), how much is burned and the BSQ/BTC conversion rate. |
|
Agree to all you proposed! |
525b624 to
fa177e1
Compare
fa177e1 to
ff21c91
Compare
|
@ManfredKarrer It is not perfect, but I think it should be enough for this release. What do you think? |
|
Looks goot to me! |
There was a problem hiding this comment.
Choose a reason for hiding this comment
The reason will be displayed to describe this comment to others. Learn more.
utACK
~@ManfredKarrer Still in progress as I'll try to add the charts we were talking about as well.
But just to have a fallback scenario PR.
Current state of the "Facts & Figures" section. It sill needs some @pedromvpg love, but for this release it should be good enough I guess.


