The Finra challenge was to make a proof of concept platform to show new correlations or new ways to visualize data in the financial industry
Given a dataset of financial advisers and related information we create a logistic regression model to classify if a financial advisor is unethical. Using the employment history from the given dataset we create relations between financial advisors. Using the ethics score and the relationships between advisors, we predict how ethical an advisor will be based on the influences around them. We also displayed individuals that we deemed to be at the highest risk of being unethically influenced that would otherwise be difficult to identify.
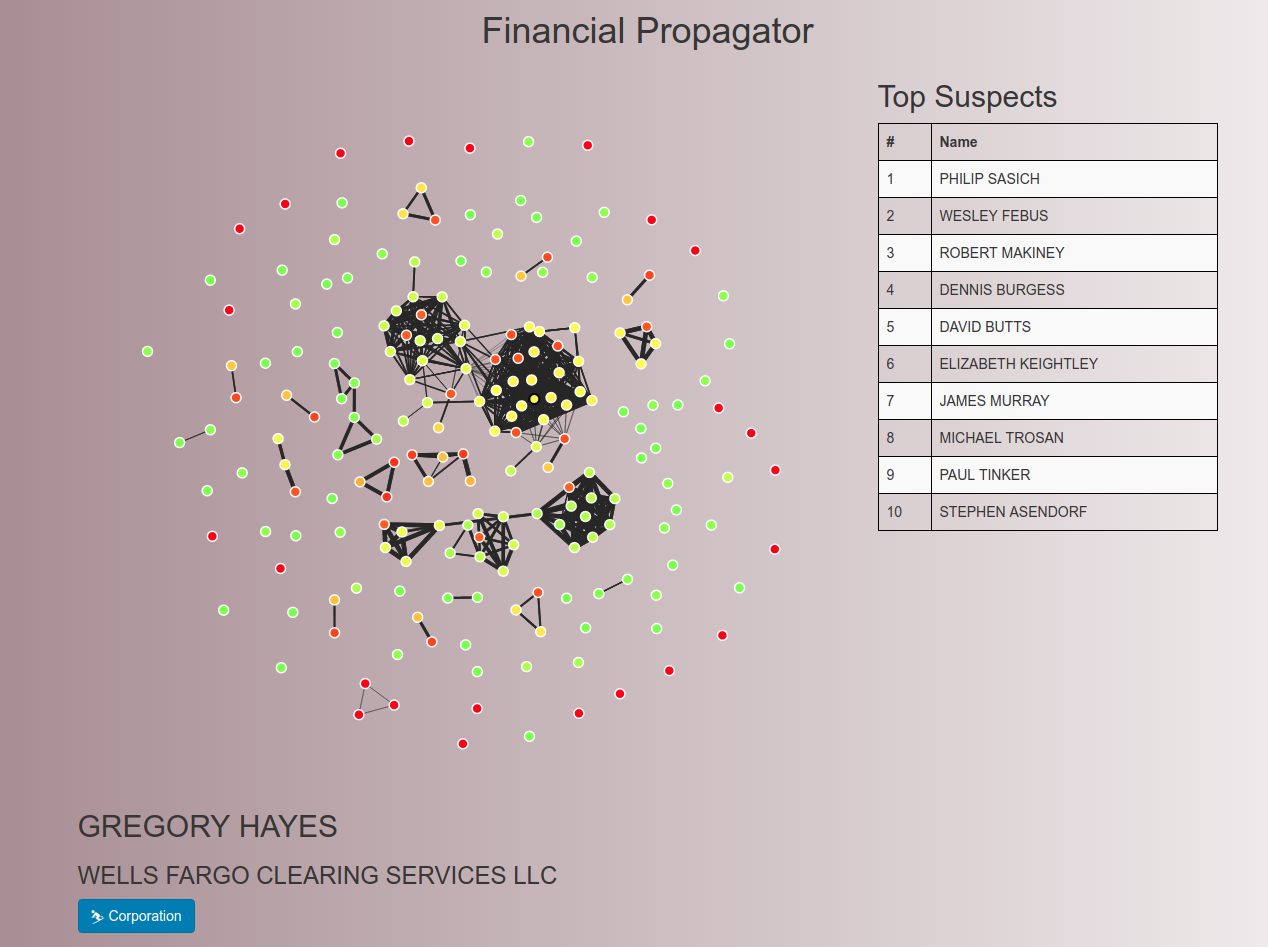
Below is the main output of the program. Nodes represent individuals, and edges represent connections based on mutual employment history. An individual's color represents their ethical score. The Top Suspects list is composed of individuals who on paper are clean but in the network are surrounded by people with many negative marks on their record.
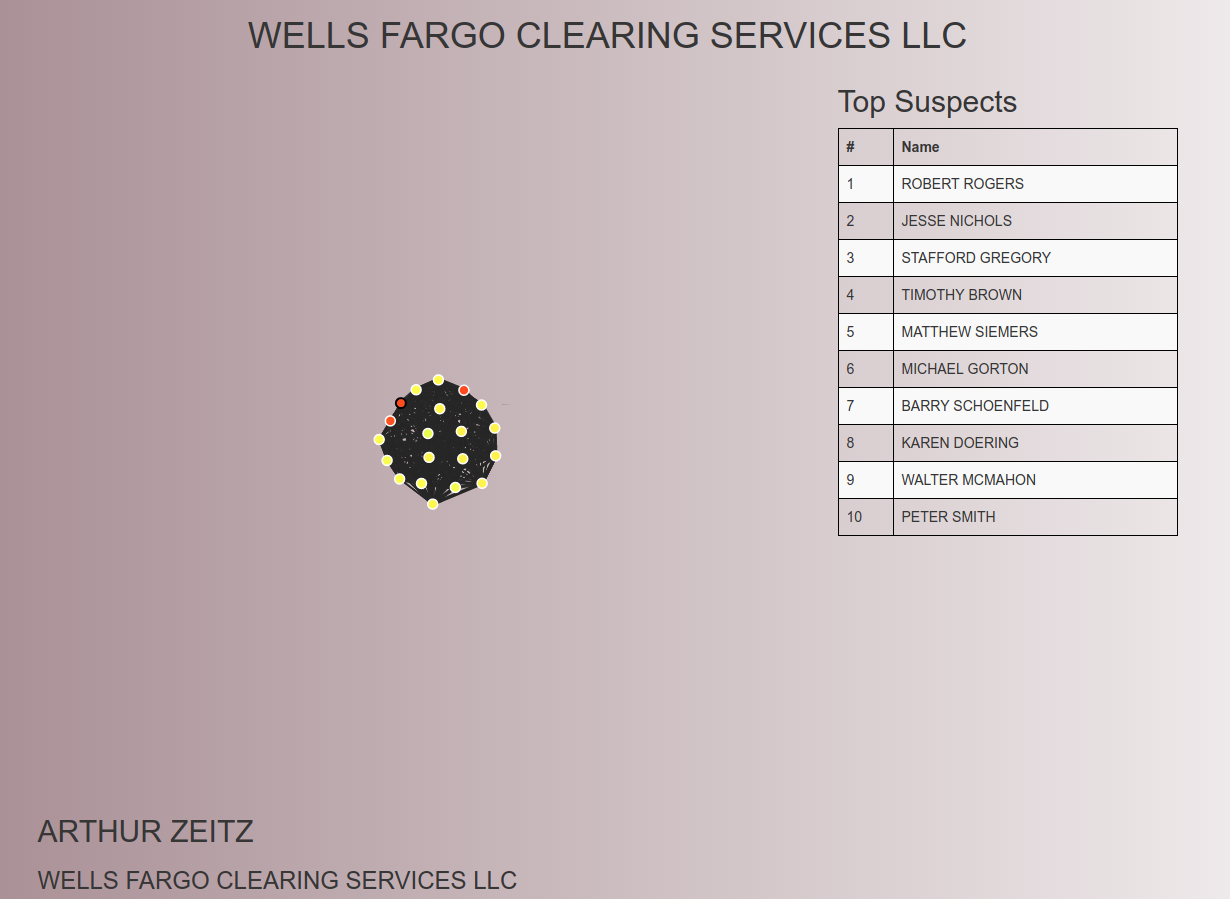
Below is an example zoomed version of a single company, displaying the level of propagation between individuals. The rankings are updated to show the suspects just within the company.
First, python was used to process the IAPD XML files and generate test data. We took a guided approach by suggesting weights that might influence how "good" an advisor is. Then, using Python's sklearn, we created a logistic regression model on a fuzzied version of the data to classify financial advisers, with some randomness that would appear in a real data set. The results up to this point were stored in a MySQL for querying relations. With the created MySQL database, we queried for a subset of individuals that would be useful for display purposes.
We created a Node.js local server that manipulated and read in the display data. From information on employment history, "close" advisors were scored by how likely they were to have known each other. A random walk was performed on each individual to determine a suggested effect an unethical advisor might have had. Using Javascript D3 for the graph visualization and React for tying components together on the UI, we outputted a visualization of the ethics and connections of all users in the sample set.
We were given an initial 35gb file with court cases but we found most of the data to be irrelevant, after a few hours of trying to use natural language processing on various parts of it.
After generating test data and training our model we found that the accuracy was unrealistically high and had to implement fuzzing to ensure a robust model.
It was difficult at first to determine what defines a meaningful interaction between two advisers.
Visualizing data with D3 was not as simple as hiding or showing a data structure.
Looking at the whole project, we have created test data to train a model, we have created a robust model to give a score for ethics, and we have implemented an algorithm to predict a financial advisor's future behavior. We are all extremely happy to see a diverse range of algorithms being implemented successfully together.
The driving force behind our Financial Ethics Propagator was that we could give a great user interface for non-obvious correlations between data. Currently we parse a specific IAPD file to make predictions specific to the financial industry. Looking forward, it would be trivial to use our model to predict things outside of the realm of the financial industry given the relevant data so we are looking to retool the input portion of our code.
Looking forward in the financial market, we feel that there are still correlations that could be easier to see. For example we think it would be useful if we could show unusual stock buying history along with our node graph. This would allow for investigators to easily navigate gigabytes of data to determine if someone has committed a fraudulent purchase

