- Easy to setup and configure. I think so.
- Light. Well RAM is so cheap nowadays.
- Not intrusive. As much as RMI could be.
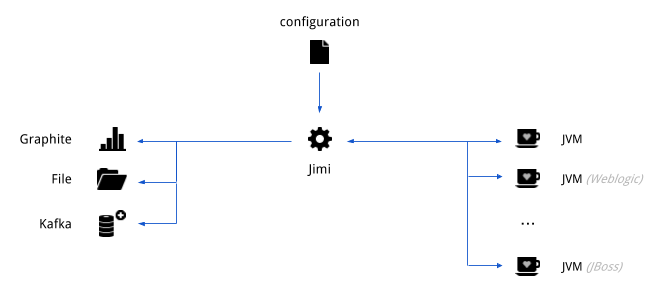
- Integration with third-party tools. Graphite, Kafka
- Getting data from Oracle JVM, Weblogic and JBoss servers. True.
- Collecting simple numeric values from MBean attributes and combined data attributes. True.
- Source – abstract representation of a source JMX server on a program level.
- Metric – definition of a measure to be collected from the source.
- Value – real value gathered from the source.
- Event – the value within its context: source, metric, timestamp.
- Writer – component of a program responsible for writing or sending events to external storage/analysis system.
Before you begin: although the code is a mess, the application is stable and does what it is supposed to do. I'm currently working on improvements.
- Download latest version of Jimi. The archive contains all needed dependences except Weblogic/JBoss client jars.
- Unzip archive somewhere on your server. We are going to refer to this place as
JIMI_HOME. - Copy
JIMI_HOME/config/jimi.yaml.exampleintoJIMI_HOME/config/jimi.yamland modify it according to your needs.
If you plan to work with Weblogic or JBoss servers you have to follow these additional steps.
All Jimi configuration defined in one file - jimi.yaml. You can name this file as you want, but here we will use highlighted name for consistency.
YAML: read and understand syntax
This file contains definitions of writers and sources that will be used by Jimi. The definitions start with a tag referring to the object's class, like !graphite for Graphite writer, !console for console writer and !jvm for JVM source. Each writer and source need its own set of properties to get the work done. Properties' names are self-explanatory most of the time. Full list of possible properties for each class can be found on Jimi's wiki.
Events produced by sources will be forwarded to all defined writers. The example file contains definitions of two writers: !console and !graphite. The first prints events to the console the second sends events to Graphite server.
The tag !jvm tells us that the source is a standard JVM JMX server. You may need to update host and port properties.
metrics property contains the names of metric groups defined in metrics library folder JIMI_HOME/metrics. You can use existing metrics or create your own, more on this here.
The last element of this file, executorThreadPoolSize property, defines the size of the thread pool used by Jimi for collection of metrics.
writers:
  - !console
    format: "${source.get('label')} ${metric.get('label')} ${value} ${ts.format('hh:mm:ss.SSS')}"

  - !graphite
    host: 172.0.0.1
    port: 2003
    format: "jimi.${source.get('label')}.${metric.get('rate')}s.${metric.get('label')} ${value} ${ts.s}"

sources:
  - !jvm
    host  : 172.0.0.1
    port  : 9001
    metrics:
      - Memory
      - MemoryPools
      - GC
      - Threading
      - System

executorThreadPoolSize: 2Jimi comes with a simple startup script run.sh that makes some assumptions about your setup: java is in the PATH, definitions of metrics are stored in JIMI_HOME/metrics folder, the main configuration file is in JIMI_HOME/config folder and the name of this file will be used as a name of Jimi instance.
To run Jimi execute this script and pass the name of configuration file as a parameter:
run.sh <name_of_config_file_without_extension>You may write your own startup script, Jimi's main class com.opshack.jimi.Jimi takes only one parameter: the path to the configuration file. The following additional options are available:
jimi.home - Jimi's home folder, default value is user.dir
jimi.name - Jimi's instance name lets you run multiple instances in the same home, default value is jimi
jimi.metrics - folder where you store yaml files with metric's definitions, default value is JIMI_HOME/metrics
Don't forget to put jimi.jar and all jars from JIMI_HOME/lib to the classpath. If you use Kafka writer, option -Djava.security.policy=file:$JIMI_HOME/jimi.policy is mandatory.
Jimi is highly inspired by my previous non open-source works, articles from monitoring sucks and the jmxtrans project.
It's not that difficult to collect JMX counters, the difficulty is to create a tool easy to configure, maintain and integrate with other applications. Having said that, it's even harder to make good use of collected data.
- Let me know if you use Jimi
- Report bugs
- Share metrics definitions
- Correct my English :)