You signed in with another tab or window. Reload to refresh your session.You signed out in another tab or window. Reload to refresh your session.You switched accounts on another tab or window. Reload to refresh your session.Dismiss alert
Use setData operation when diffing geojson sources #5332
Return early from draw calls on layers where opacity=0 #5429
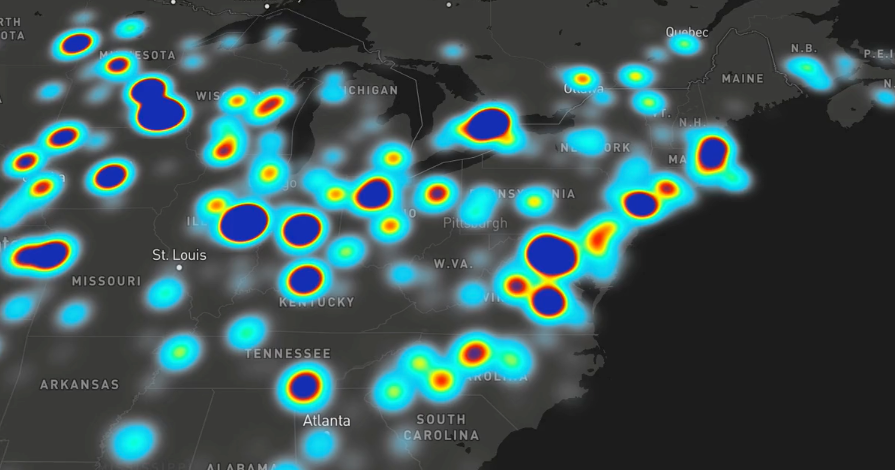
A heatmap layer type is now available. This layer type allows you to visualize and explore massive datasets of points, reflecting the shape and density of data well while also looking beautiful. See the blog post for further details.
The value of a style property or filter can now be an expression. Expressions are a way of doing data-driven and zoom-driven styling that provides more flexibility and control, and unifies property and filter syntax.
Previously, data-driven and zoom-driven styling relied on stop functions: you specify a feature property and a set of input-output pairs that essentially define a “scale” for how the style should be calculated based on the feature property. For example, the following would set circle colors on a green-to-red scale based on the value of feature.properties.population:
This approach is powerful, but we’ve seen a number of use cases that stop functions don't satisfy. Expressions provide the flexibility to address use cases like these:
Multiple feature properties
Using more than one feature property to calculate a given style property. E.g., styling land polygon colors based on both feature.properties.land_use_category and feature.properties.elevation.
Arithmetic
For some use cases it’s necessary to do some arithmetic on the input data. One example is sizing circles to represent quantitative data. Since a circle’s visual size on the screen is really its area (and A=πr^2), the right way to scale circle-radius is square_root(feature.properties.input_data_value). Another example is unit conversions: feature data may include properties that are in some particular unit. Displaying such data in units appropriate to, say, a user’s preference or location, requires being able to do simple arithmetic (multiplication, division) on whatever value is in the data.
Conditional logic
This is a big one: basic if-then logic, for example to decide exactly what text to display for a label based on which properties are available in the feature or even the length of the name. A key example of this is properly supporting bilingual labels, where we have to decide whether to show local + English, local-only, or English-only, based on the data that’s available for each feature.
String manipulation
More dynamic control over label text with things like uppercase/lowercase/title case transforms, localized number formatting, etc. Without this functionality, crafting and iterating on label content entails a large data-prep burden.
Filters
Style layer filters had similar limitations. Moreover, they use a different syntax, even though their job is very similar to that of data-driven styling functions: filters say, “here’s how to look at a feature and decide whether to draw it,” and data-driven style functions say, “here’s how to look at a feature and decide how to size/color/place it.” Expressions provide a unified syntax for defining parts of a style that need to be calculated dynamically from feature data.
For information on the syntax and behavior of expressions, please see the documentation.
🔧 Development workflow improvements
Made the performance benchmarking runner more informative and statistically robust
The text was updated successfully, but these errors were encountered:
mapbox-gl-js-bower has been updated with v0.41.0:
https://github.com/archesproject/mapbox-gl-js-bower/tree/v0.41.0
Testing will be required to confirm this doesn't break existing functionality
The Changelog claims there is a few breaking changes from the version currently pinned (0.40.1).
here are the changes:
0.41.0 (October 11, 2017)
Map#setStyle.canvassourcecontextTypeoption added in 0.40.0 #5449🐛 Bug fixes
✨ Features and improvements
Use setData operation when diffing geojson sources #5332
Return early from draw calls on layers where opacity=0 #5429
A heatmap layer type is now available. This layer type allows you to visualize and explore massive datasets of points, reflecting the shape and density of data well while also looking beautiful. See the blog post for further details.
The value of a style property or filter can now be an expression. Expressions are a way of doing data-driven and zoom-driven styling that provides more flexibility and control, and unifies property and filter syntax.
Previously, data-driven and zoom-driven styling relied on stop functions: you specify a feature property and a set of input-output pairs that essentially define a “scale” for how the style should be calculated based on the feature property. For example, the following would set circle colors on a green-to-red scale based on the value of
feature.properties.population:This approach is powerful, but we’ve seen a number of use cases that stop functions don't satisfy. Expressions provide the flexibility to address use cases like these:
Multiple feature properties
Using more than one feature property to calculate a given style property. E.g., styling land polygon colors based on both
feature.properties.land_use_categoryandfeature.properties.elevation.Arithmetic
For some use cases it’s necessary to do some arithmetic on the input data. One example is sizing circles to represent quantitative data. Since a circle’s visual size on the screen is really its area (and A=πr^2), the right way to scale
circle-radiusissquare_root(feature.properties.input_data_value). Another example is unit conversions: feature data may include properties that are in some particular unit. Displaying such data in units appropriate to, say, a user’s preference or location, requires being able to do simple arithmetic (multiplication, division) on whatever value is in the data.Conditional logic
This is a big one: basic if-then logic, for example to decide exactly what text to display for a label based on which properties are available in the feature or even the length of the name. A key example of this is properly supporting bilingual labels, where we have to decide whether to show local + English, local-only, or English-only, based on the data that’s available for each feature.
String manipulation
More dynamic control over label text with things like uppercase/lowercase/title case transforms, localized number formatting, etc. Without this functionality, crafting and iterating on label content entails a large data-prep burden.
Filters
Style layer filters had similar limitations. Moreover, they use a different syntax, even though their job is very similar to that of data-driven styling functions: filters say, “here’s how to look at a feature and decide whether to draw it,” and data-driven style functions say, “here’s how to look at a feature and decide how to size/color/place it.” Expressions provide a unified syntax for defining parts of a style that need to be calculated dynamically from feature data.
For information on the syntax and behavior of expressions, please see the documentation.
🔧 Development workflow improvements
The text was updated successfully, but these errors were encountered: