-
Notifications
You must be signed in to change notification settings - Fork 6.7k
Is ui.bootstrap.modal leaking DOM? #1491
Comments
|
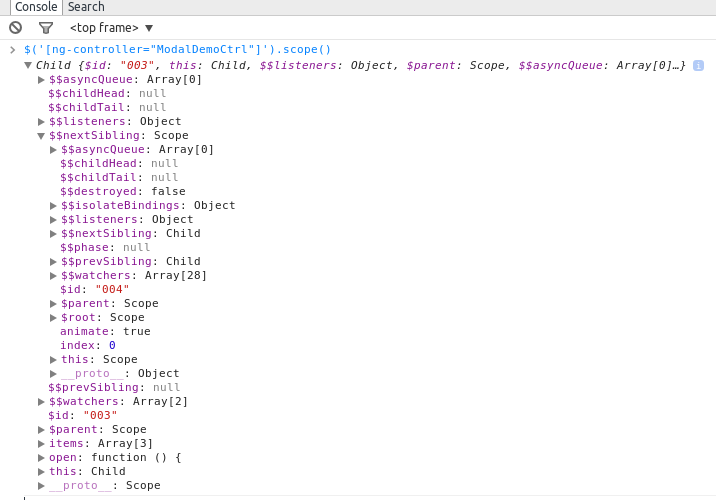
Verified that this is an issue. This is due to us re-using the modal scope. Each time the scope is re-used and attached on a different element, watchers are added onto the scope. Working on a fix now. |
Previously, the backdropScope was being re-used and each time it was
linked, it would attach more watchers to the scope.

Resolves angular-ui#1491
|
Great @chrisirhc this fixed the DOM leak but the memory is still growing in the same proportion. |
|
I'm looking at this on http://plnkr.co/edit/sXEWZnq8LUKhRzJcmoly?p=preview (this contains the fix in the PR #1498), at it seems fine just that the garbage collector is taking its time. If you invoke garbage collection, memory usage goes back down again. Here's a Heap Timeline I got from Chrome. The little blue bits (retained objects in memory) are parts probably coming from Plunker. I checked that it wasn't anything within ui-bootstrap. Here's what I saw on the Timeline tab (Memory usage). Could you post up what you're seeing? |
|
I just follow below steps:
This remains same for the third snapshot after sometime assuming the GC kicked up inbetween. |
|
The heap snapshot is not adequate to determine that this was caused by UI Bootstrap. This is because it also contains references to Plunker's source code and windows. Did you try this on your local copy instead of Plunker? (And make sure you're using the version with the fix, the fix has not been merged into master.) I have double-checked the Heap Timeline and see nothing that the modal is adding that's leaking. This is what happens on the Plunker demo if I click open and dismiss 10 times. Each spike is probably an allocation for the window. It grays out afterwards meaning it has been deallocated successfully. I have also checked the contents of the retained objects and there isn't anything that is caused by the modal. Another thing, you can manually invoke the GC in the Timeline tab of the Chrome Developer Tools. |
|
Yes, I'm checking locally. It seems that "record heap allocation" does not show anything suspicious but "take heap snapshot" shows the memory growing. |
|
@codef0rmer @chrisirhc I've just checked it with @chrisirhc fix and I can't see leaks (DOM node or memory) any more. Forcing GC brings memory usage, nodes and handlers count to the initial level. @codef0rmer be sure to run plunker in a separate incognito window and use the run mode (http://run.plnkr.co/IfshH8eXj6bF70tL/) to remove any interference from browser plugins and plunker itself. I'm going to merge @chrisirhc PR, @codef0rmer please open another issue if you still see leaks after checking in the isolated mode as described above. |
|
Thanks @pkozlowski-opensource and @chrisirhc, seems the issue has been fixed based on dom nodes and handlers which restore back to its original state. But "take heap snapshot" option showing growth in memory. If you people think its not because of memory leak then I'm okay with it. Thanks again for a quick fix. |
|
@codef0rmer I'm not saying that there is no potential memory leak - just saying that couldn't see it after @chrisirhc fix in my environment. |
|
@pkozlowski-opensource I meant if you did not see memory growing in between heap snapshots then I'm okay with it. It may be an issue with my environment. |
|
I'm also seeing a memory leak with opening and closing modals, using version 0.10.0. It looks like the scope for the modal window is never actually destroyed. In version 0.9.0 (that the old demo was using), removeModalWindow was calling modalWindow.modalScope.$destroy(), but that line was apparently removed for 0.10.0. Putting it back in seems to fix things. |
|
I create a plunk for it (which is really just codef0rmer's with the version updated): |
|
@nwbvt this was fixed in 0.11.0, there is not much point debugging old version and commenting in a closed issue. If you see the same / similar problem in 0.11.0 please open a new issue with a minimal reproduce scenario. Thnx! |


Here is an example from the demo page.
http://plnkr.co/edit/olojiFn4uowB7eAvZ2jQ?p=preview
I just open and close modal multiple times and you can see the memory has grown. There are some dom leaks also shown in the below screenshot.

I also noticed that the$watchers list in $ $nextSibling is also growing.

The text was updated successfully, but these errors were encountered: