An extension to Visual Studio that provides a TracePoints tool window with filterable view of TracePoints that fire while debugging.
Under Construction
- Install from the Visual Studio Marketplace or the unsigned latest release
Once installed you can find the TracePoint tool window in the View->Other Windows->TracePoints Window. The tool window can be docked like any other tool window and can be left open before, during and after debugging. If you leave the window open after a debugging session the messages will still be displayed.
Then you just need to add a TracePoint while debugging and you will see the message from the TracePoint in the TracePoint window as well as in the output window. You can learn more about using TracePoints from the official documententation
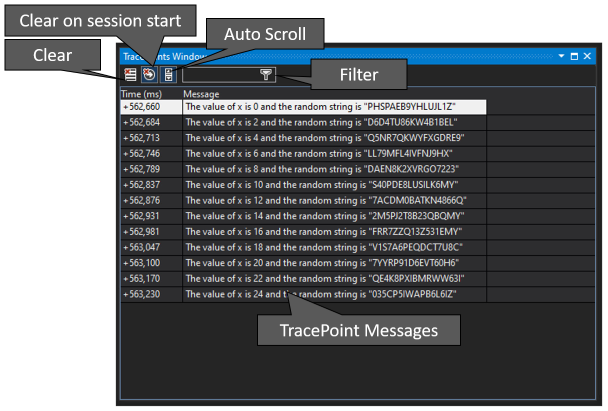
Each row in the TracePoint windows corresponds to a bound TracePoint firing. The first column shows the time, in milliseconds, since the start of the current debug session, and the second column shows the contents of the TracePoint message.
Clicking this button clears all the messages in the current display.
This is a toggle button. In the checked state, blue outline, the messages will be cleared when a new debug session starts. In the unchecked state messages won't be cleared on a new debug session and will persist until manually cleared. When not clearing messages on session start it's worth keeping in mind that the times are relative to the start of each induvial debug session. The default is checked.
This is a toggle button. In the checked state, blue outline, the view will scroll to show the latest message added. In the unchecked state the scroll position will stay the same. The default is checked.
Typing in the filter text box will winnow the list of messages to those containing the filter string. The comparison is case insensitive and currently only simple string comparisons are supported, no regular expressions.