-
Notifications
You must be signed in to change notification settings - Fork 0
New issue
Have a question about this project? Sign up for a free GitHub account to open an issue and contact its maintainers and the community.
By clicking “Sign up for GitHub”, you agree to our terms of service and privacy statement. We’ll occasionally send you account related emails.
Already on GitHub? Sign in to your account
Tracing the Redwood Blog Authentication code #4
Comments
Development Environment Setup1. Setup Redwood Blog application (prepare the debugging target)using the information from what's Next Redwood Tutorial section. To explain the use of debugging tools in a debugging task, we need an application to be debugged. Reducing the application to a code snippet is not nearly as good approach, since the whole application's context plays a significant role. Rather than creating such application from scratch, sufficiently complex to illustrate debugging practices, the well known application that was built in the course of the Redwood Tutorial will be used instead. This application (Redwood Blog) exists in this repository. Make a local clone and run it, using the commands defined in the section using the example repo of the Redwood Tutorial. Since the line resulting with the front end of the Redwood Blog application running in the browser
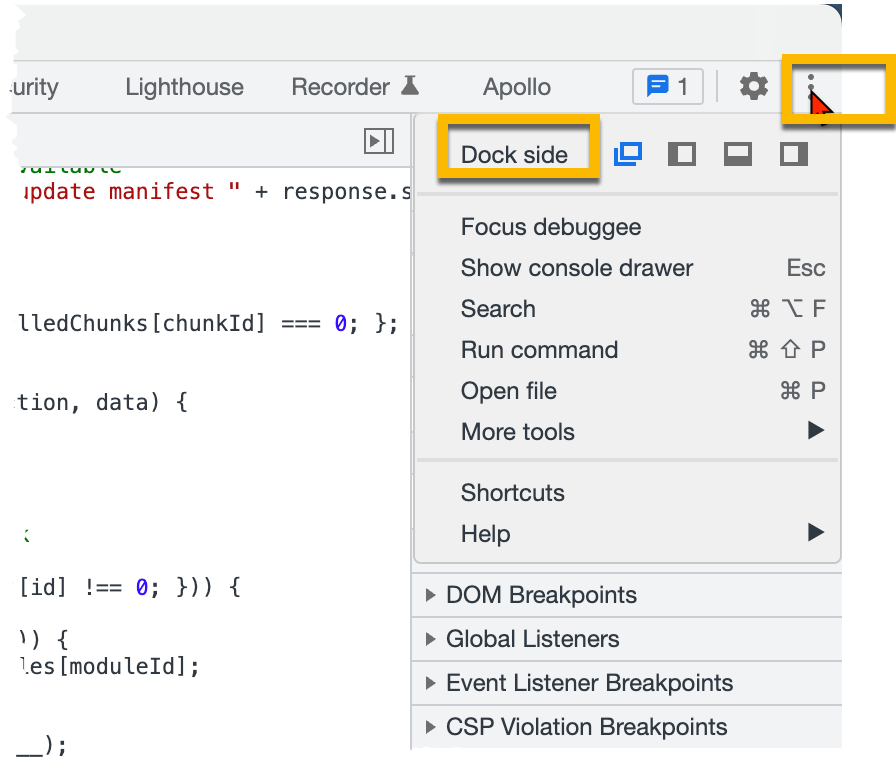
2. Setup the DevTool debuggerusing the article debugging with chrome Having the Redwood Blog app running in the browser, invoke the DevTools from the browser menu with clicks 1, 2 and 3 Click on the menu item 3, the debugger will launch next to application running in the browser resulting with:
The devtools docking (dock on the right in the above image) can be set according to the Image 4 (below)
Note: the browser panel with Redwood Blog is placed next to the devtools panel only as a convenience (so you can restart the application for example). Having just a single monitor, you can do everything on the devtools panel alone. 3. Setup Visual Studio Code debuggerassuming that the Visual Studio Code is already installed (if not, visit the Visual Studio Code home page and observe that the you will be prompted with the download button that preselects your development platform. Download and install it, and then continue with the ???? paragraph) ... more to come here ... |
Planing the articleThis section is created for the benefit of the people providing the feedback before the actual article gets written as well as the guideline for the author. This approach provides the clarity for the team to provide the feedback feedback needed for writing a well designed Cookbook entry. |
|
saving the space |
Tracing the authentication code with DevToolsWaiting for the discussion and decision on Planing the article. |
Tracing the authentication code with VSCodeWaiting for the discussion and decision on Planing the article. |


Introduction
This first article explains the process of stepping through code using the debugger - not to chase a bug, but to get familiar with the debugger tool used to verify the correctness of a process flow.
Initially we will use the material from the Redwood Tutorial as the context, the cookbook articles are derived from. Limiting ourselves to this context is likely not sufficiently ambitious, but it will be a good start. Since authentication issues are famously fickle (quote from the authentication section of the Redwood Tutorial), we believe that presenting a detailed examination of the authentication process by stepping through the code using a debugger - either the Chrome debugger which is a part of DevTools, or VSCode debugger
The mechanics of using the either of two debuggers that will appear in this article will be presented later
The text was updated successfully, but these errors were encountered: