This repository includes code and figures for the report "Spread of COVID-19 through Georgia, USA. Near-term projections and impacts of social distancing via a metapopulation model" which describes the development and application of an epidemiologial metapopulation model to Georgia, USA. The model includes asymptomatic and symptomatic transmission routes, subactute and critically hospitalised compartments; and age-stratified risk. Counties are chosen as the spatial units in the metapopulation framework; where movement of people between counties is modelled implicitly. The code is written in and run in Julia v1.3.1.
Social distancing policies are saving lives
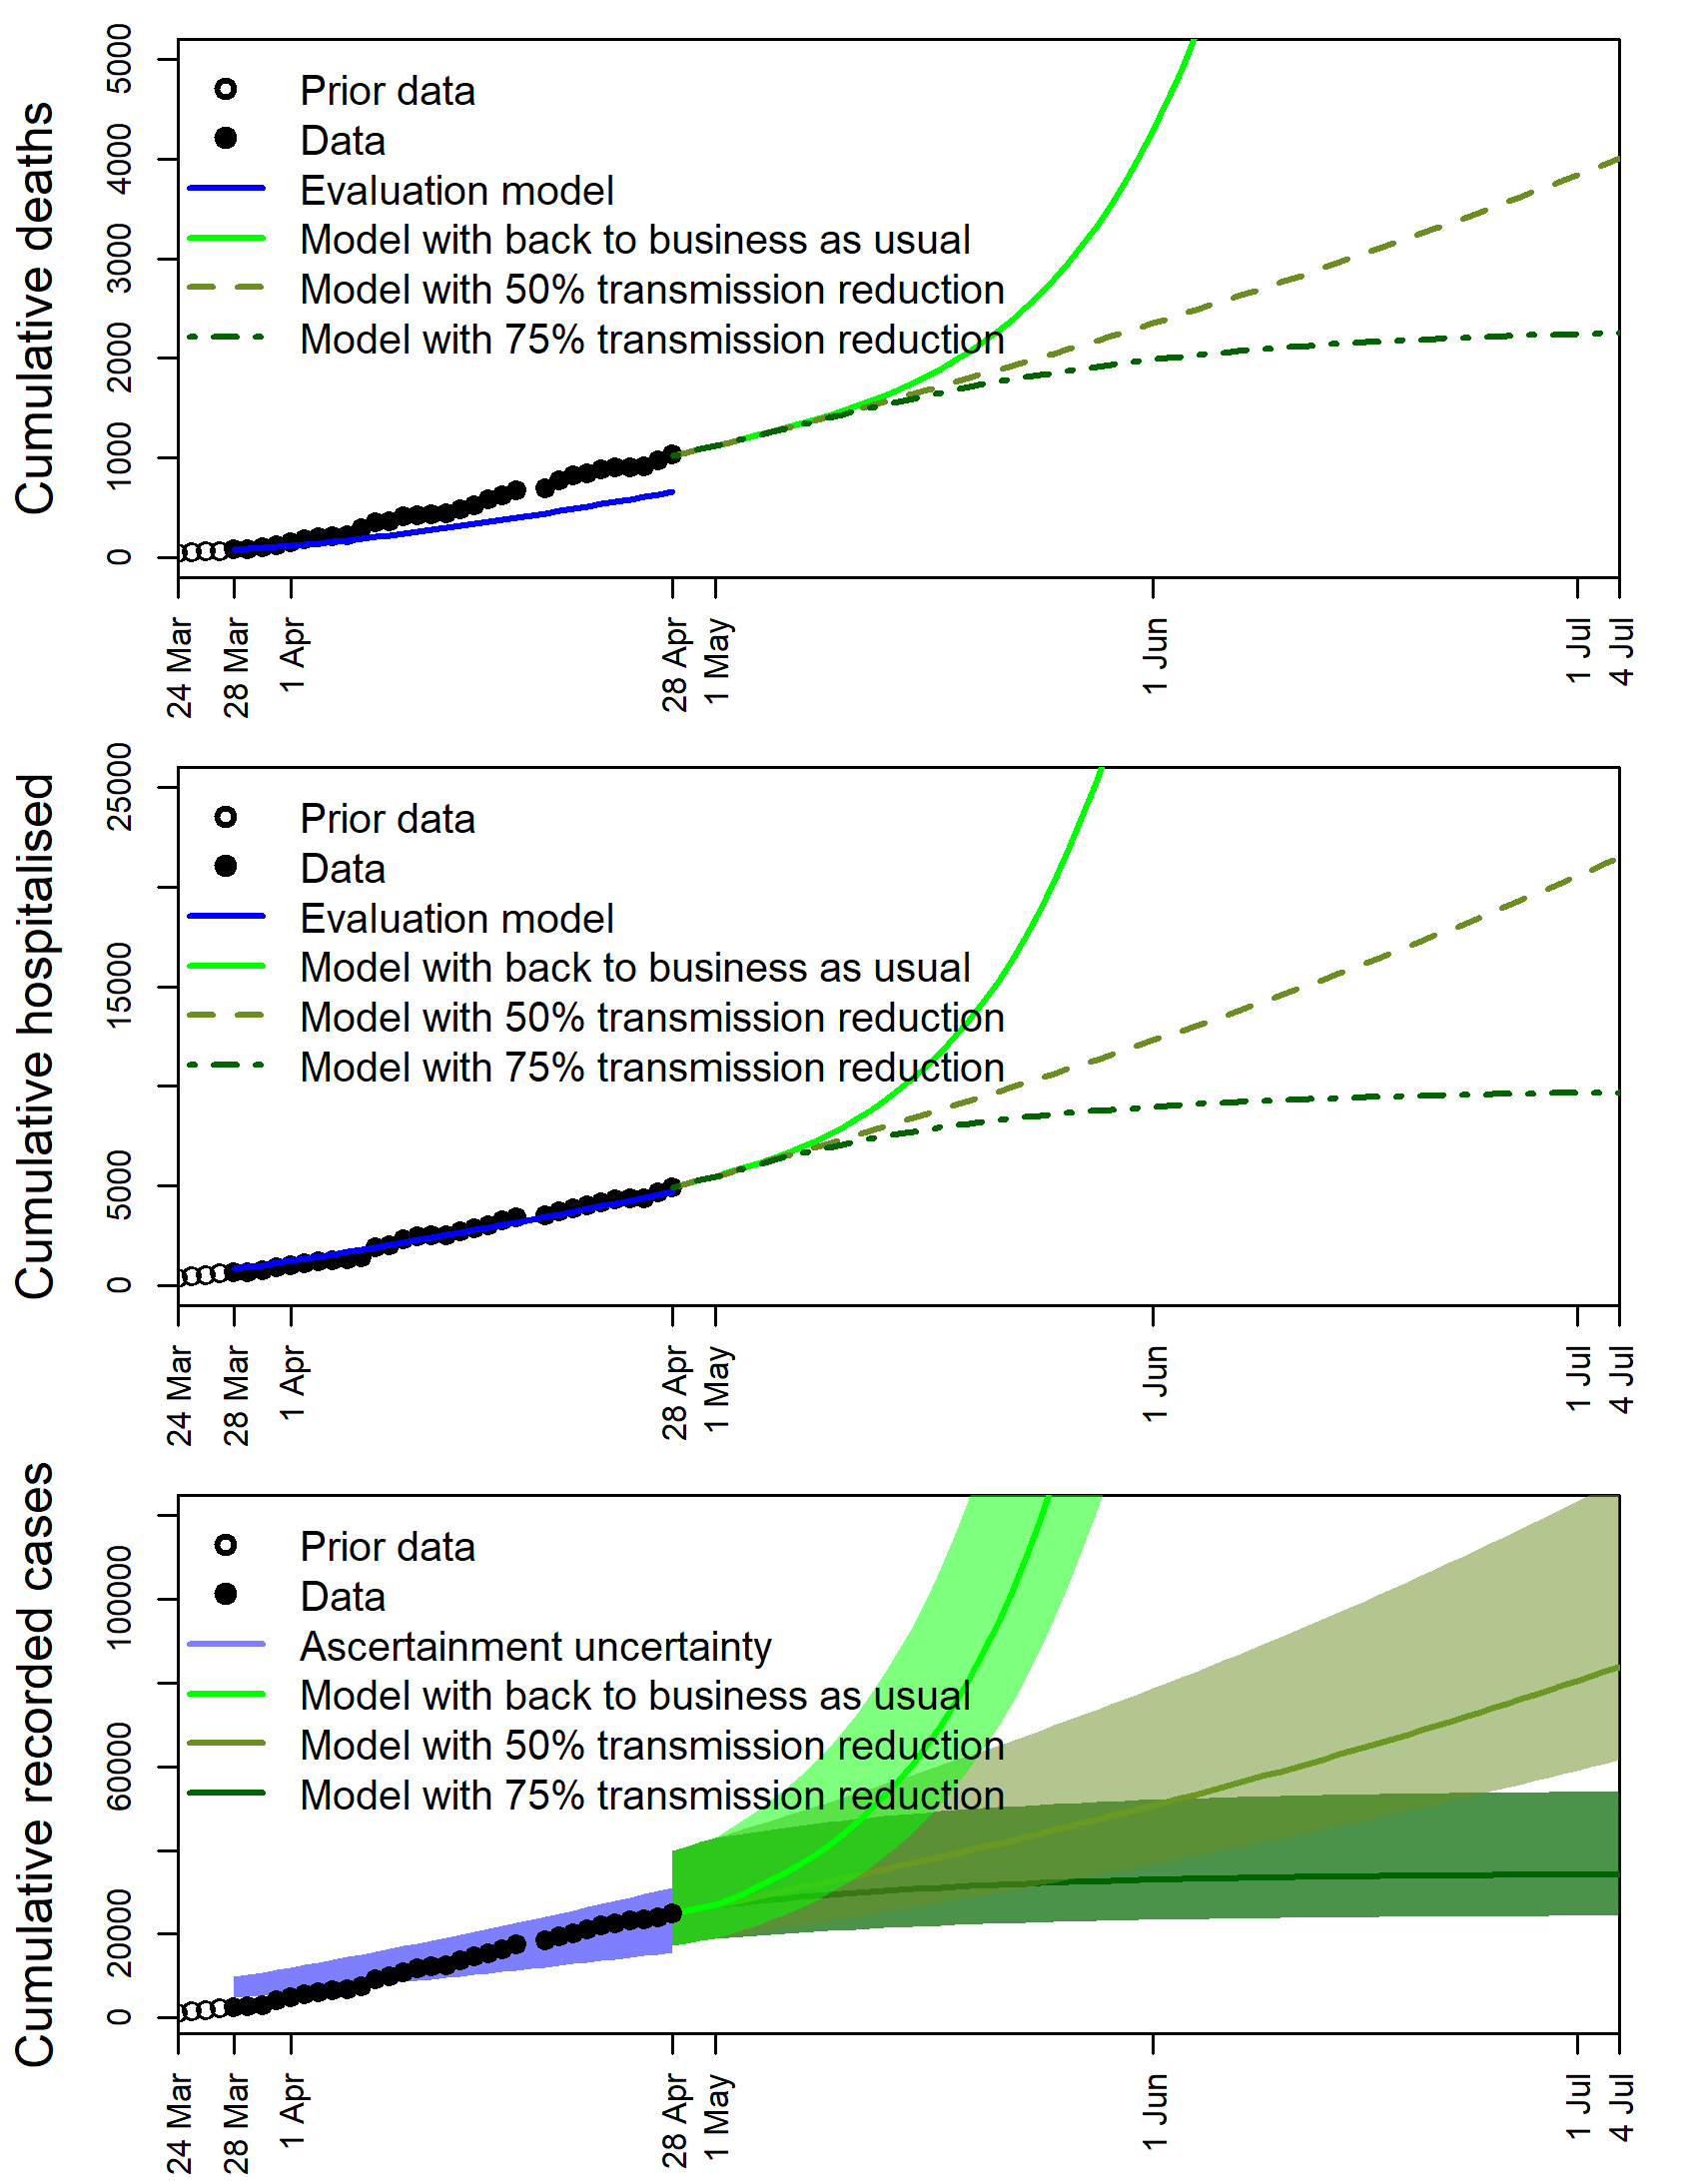
Reopening threatens to lead to an increase in cases as the population is immunologically naïve.
Many more cases exist than are measured
Our models suggest Georgia is detecting between one of every five to ten COVID-19 cases. Both
serological and viral shedding tests are urgently required at scale to assess the true prevalence.
COVID-19 is a long-term challenge
Even in the best case scenarios, COVID-19 remains a threat post-Memorial Day. Relaxing social
distancing interventions now without robust plans to contain the outbreak endangers lives.
Access the executive summary here:
COVID-19 assessment of reopening Georgia
Access our 2lst April report here:
Spread of COVID-19 through Georgia, USA. Near-term projections and impacts of social distancing via a metapopulation model
Access our 28th May manuscript here:
Spread of COVID-19 through Georgia, USA. Near-term projections and impacts of social distancing via a metapopulation model
Beckett SJ, Dominguez-Mirazo M, Lee S, Andris C, Weitz JS (2020) Spread of COVID-19 through Georgia, USA. Near-term projections and impacts of social distancing via a metapopulation model. https://github.com/WeitzGroup/MAGEmodel_covid19_GA/blob/master/Report/GA_COVID19_assessment_21Apr2020.pdf
Beckett SJ, Dominguez-Mirazo M, Lee S, Andris C, Weitz JS (2020) COVID-19 assessment of reopening Georgia. https://github.com/WeitzGroup/MAGEmodel_covid19_GA/blob/master/Report/GA_COVID19_summary_28Apr2020.pdf
The manuscript is in review and has been posted to medrXiv as a preprint:
Beckett SJ, Dominguez-Mirazo M, Lee S, Andris C, Weitz JS (2020) Spread of COVID-19 through Georgia, USA. Near-term projections and impacts of social distancing via a metapopulation model. medRxiv 2020.05.28.20115642 https://doi.org/10.1101/2020.05.28.20115642
Beckett SJ, Dominguez-Mirazo M, Lee S, Andris C, Weitz JS (2020) Spread of COVID-19 through Georgia, USA. Near-term projections and impacts of social distancing via a metapopulation model. Zenodo. https://doi.org/10.5281/zenodo.3759966
Simulations are run in Julia v1.3.1 in a jupyter notebook using the file: MAGE_GA_COVID19.ipynb .
Simulation output is saved into the SimulationOutput directory as csv files.
Figures made for the report are generated using R 3.5.3 using the file: MappingCovidCounty.R .
The generated figures are saved to the figures directory.
Data required for simulations and mapping is found in the data directory.
The reports are stored in the Report directory.
For the manuscritpt figures were generated in R 4.0.0 using the file: msFigures.R
These figures are saved to the msFigures directory.
