-
Notifications
You must be signed in to change notification settings - Fork 17
Role Hierarchy Reports
To look at role hierarchy, look at SFGrantReport.<prefix>.<connectionname>.<timestamp of report generation>.html file.
The file contains list of all the roles and links to their visual representation in:
- SVG - viewable in browser and embeddable in charting programs
- PNG - image for browsers and suitable for embedding in documents
- PDF - viewable as document and printable
- Online - viewable and editable in online GraphViz editor
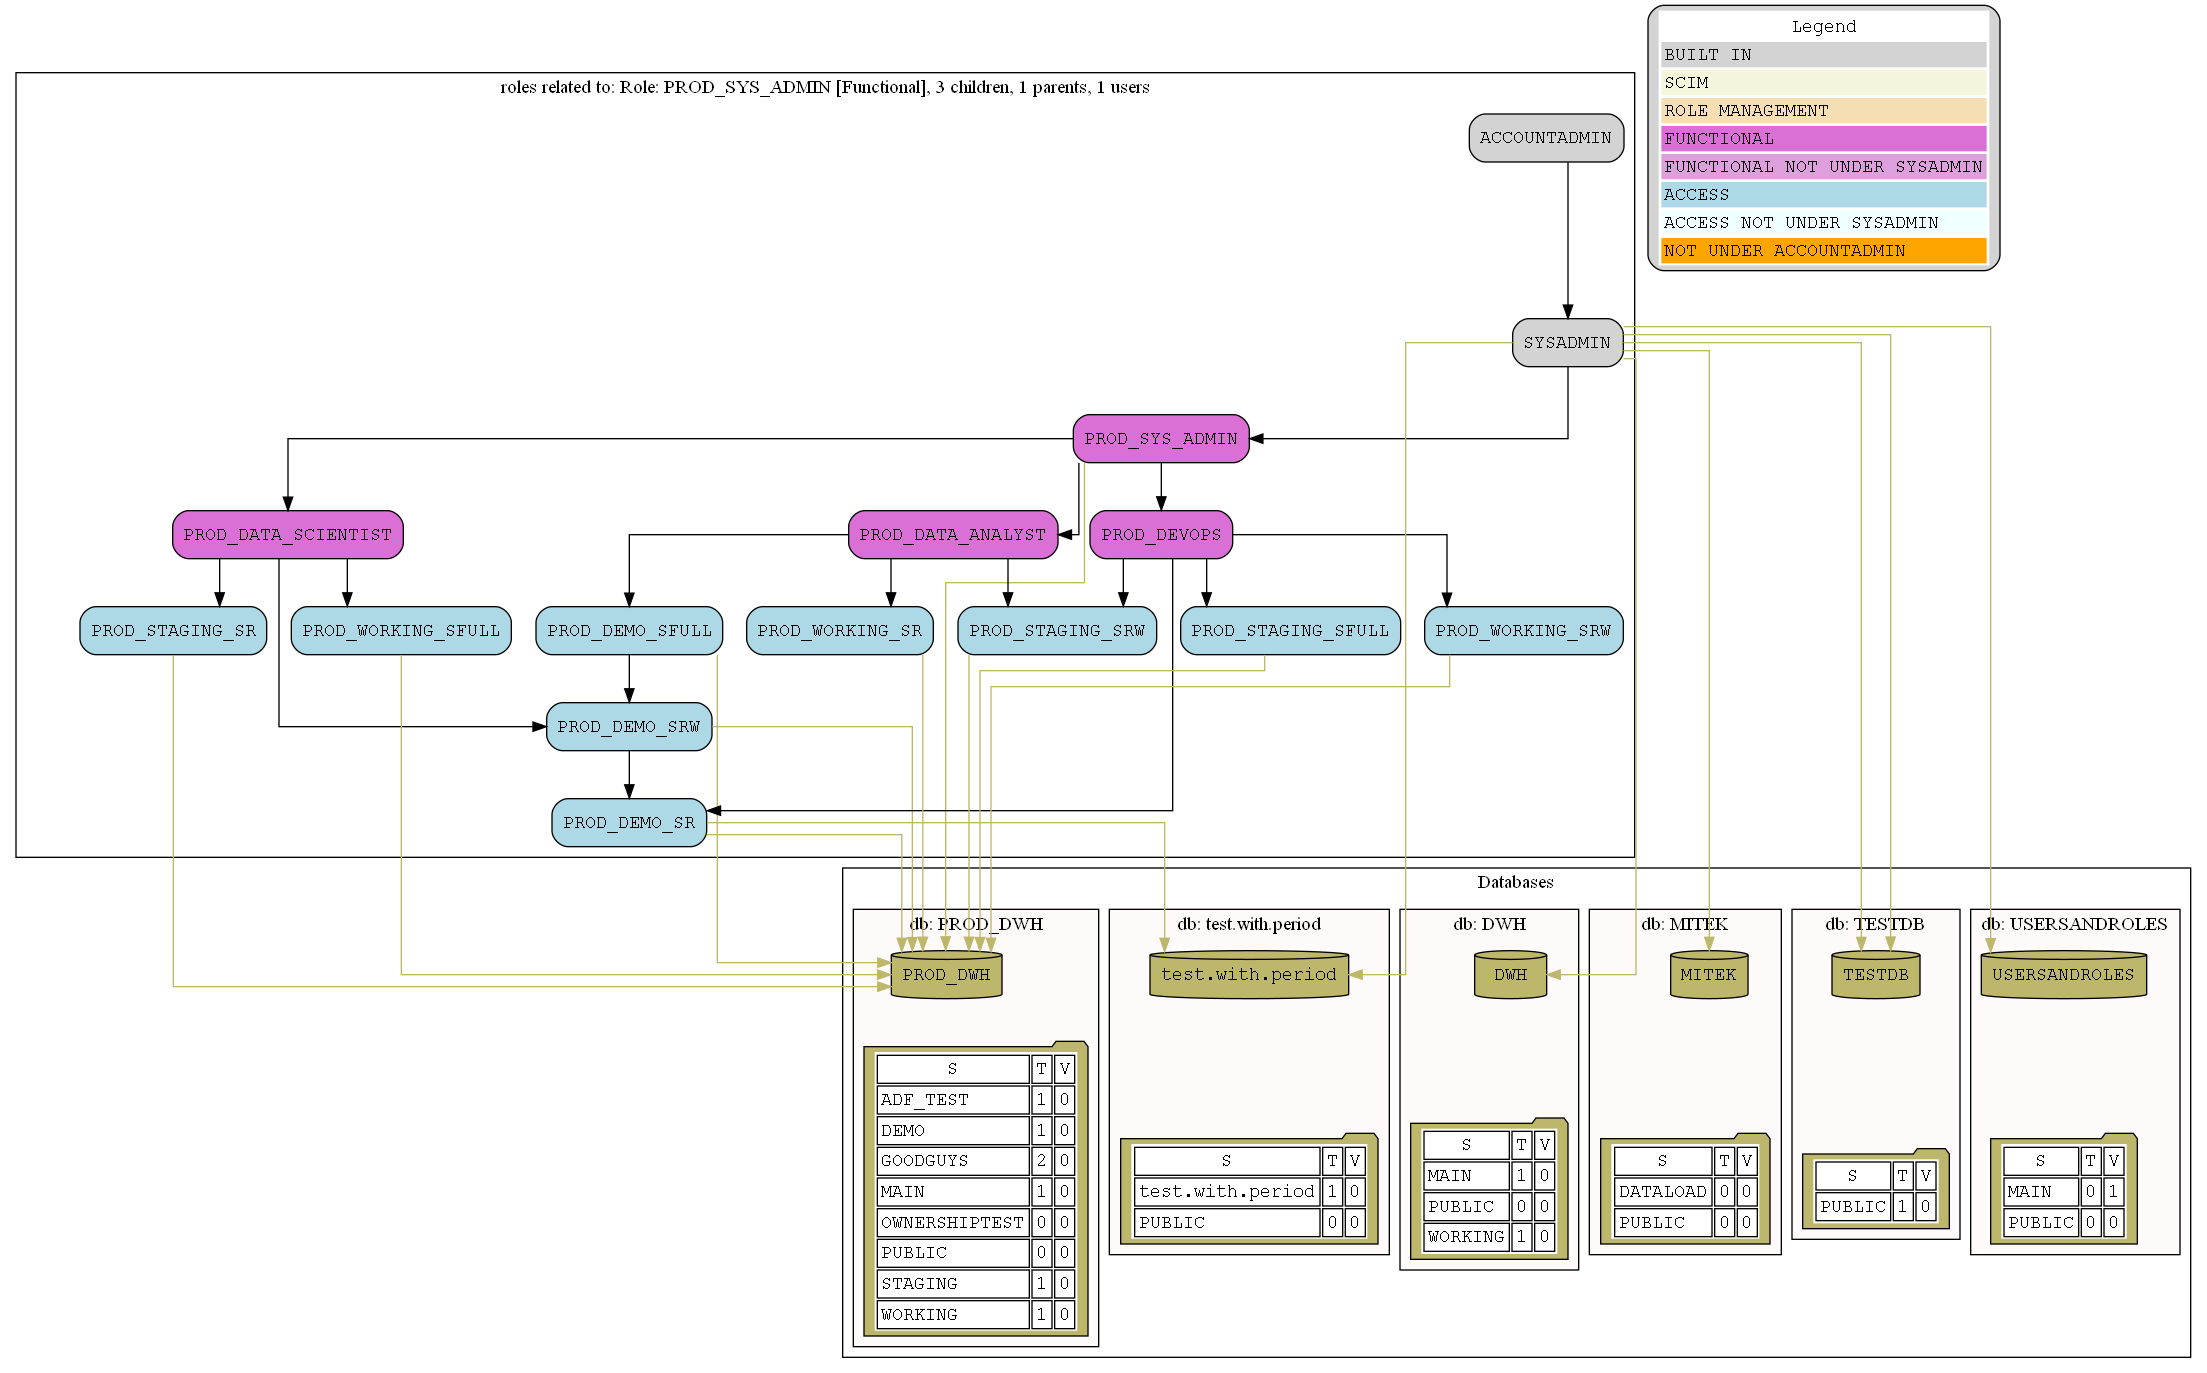
An example hierarchy graph looks like this, incorporating:
- All Roles related to the Role being displayed, both Granted To and Granted On and including all direct ancestors and descendants
- All Databases being used by to all Roles being displayed
- Legend explaining colors of the Roles being displayed
At the top of the file there is a ALL_ROLES_TOGETHER_SYNTHETIC Role that shows all Roles inheritance but omits databases.
Role Types are color coded in the visual legend:
The colors are:
| Type | Color |
|---|---|
| BuiltIn | lightgray |
| SCIM | beige |
| RoleManagement | palegreen |
| Access | lightblue |
| AccessNotUnderSysadmin | azure |
| Functional | orchid |
| FunctionalNotUnderSysadmin | plum |
| Unknown | navajowhite |
| UnknownNotUnderAccountAdmin | orange |
Role using another Role (via GRANT ROLE ROLE_A TO ROLE ROLE_B) is represented by black connecting arrows.
In this example, Role PST_WORKSPACE is granted to SKE_P_DEMO and _AC_R_SOP_P_DEMO_RBAC_GEN, while SKE_P_DEMO is granted to _AC_R_SOP_P_DEMO_RLS and _AC_R_DSC_P_DEMO_SENTIMENT:
Role being granted USAGE or having OWNERSHIP of the Database is represented by darkkhaki connecting arrows.
In this example, _AC_R_SOP_P_DEMO_RLS role is granted USAGE on SOP_P_DEMO database:
Database tiles include a table of first 10 Schemas showing counts of Tables and Views in T and V columns:
In this example, SOP_P_DEMO database is shown to have RBAC_GEN Schema with 7 Tables and 7 Views, as well as RLS Schema with 3 Tables and 4 Views:
The GraphViz files are located in Your\RPT\GRAPHVIZ\<Your Role>.gv.
You can produce your own output roles by running the following dot command:
dot -Tsvg -o"path\to\your\output\yourrole.svg" "path\to\your\report\RPT\GRAPHVIZ\yourrole.gv"


