Home

We all need to take surveys of some kind. Sometimes these are official surveys where we need to tally answers and get some counts. Other times we just need a simple way to collect information from somebody to keep on file.
Either way, there are two basic types of surveys that this plugin provides.
- Questions with blanks to be filled in and filed.
- Tests that are graded.
Any survey can be turned into a test by enabling test-mode and specifying the "passing grade" and setting the correct answers.
After installing the plugin you will be nearly ready to go. To find the pages
for administering the Survey System, you will go to your Admin Tools > Installed
Plugins page. There you will find the new Surveys page that allows you to
create surveys.
The first thing you will need to do is create a new category to put your surveys in. Then you can start creating surveys.
If you are planning to add a public facing page for taking surveys you will
need to add that page yourself. An internal page is configured for you which
you can use as a template, but it is basically just adding the new
Survey Entry block to a page. We would suggest giving it a route that
matches the internal route, SurveyEntry/{SurveyId}. Then you can direct
people to take a survey by going to http://www.example.org/SurveyEntry/1.
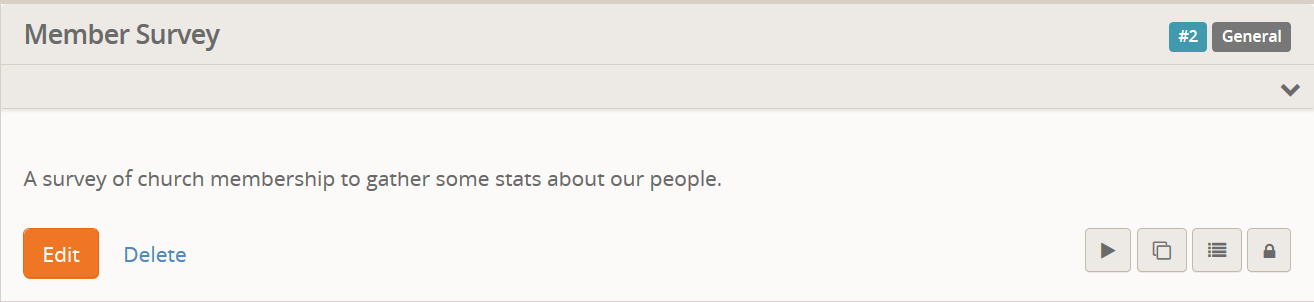
Let's start with a simple survey that asks the user some questions and stores the data for us to look at later. We are going to setup a Member Survey that we will ask all congregants to take so we can get an idea of what kinds of things we need to improve.
While you can build such a survey with a Workflow, those take time and a bit of elbow grease to build. You probably can't have your assistant build up a survey from a Workflow. But, your assistant can probably build up a survey with this plugin.
Note: There are times you are going to want to use a workflow for everything. This is not meant to completely replace those instances, but if you just need to process the results with a workflow you can setup a Workflow Trigger to handle the results and do whatever you need with them after they are saved.
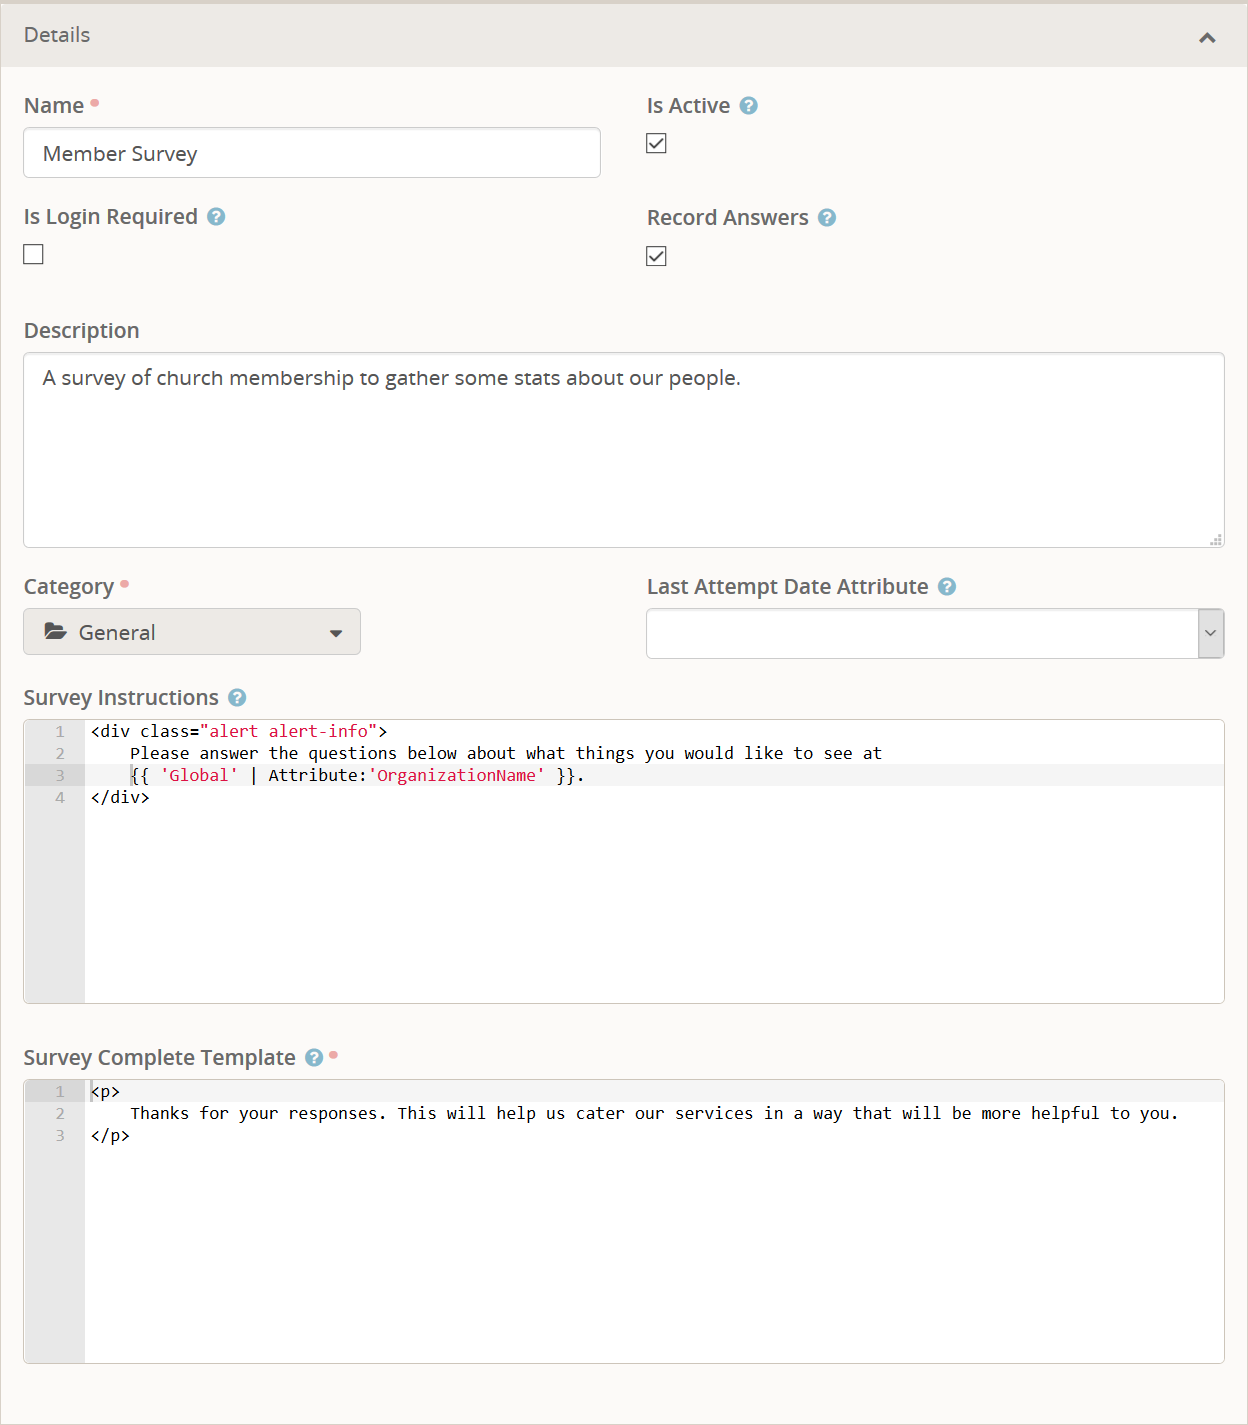
Here you will set the basic settings for a Survey. Give it a Name that makes
sense to you, but make sure it is user-friendly. Currently this name is only
used internally but it might end up used on front-facing pages in the future.
The Description will only ever be used internally and you should provide as
much detail as you can so you remember what this survey was being used for.
Normally the survey will be set active, but once the survey is finished
and you want to ensure that nobody else can take the survey you can set
Is Active to false. Most surveys will also be set to record answers, but if
you are only going to be recording when they took the survey then you can
turn this off.
Each Survey can also be flagged to require the person to be logged in. If this flag is turned on then they will be redirected to the login page. It functions identically to the way Event Registration handles the same flag.
If you need to move the Survey to another Category then you can specify which
category this survey will be in. If you specify a Last Attempt Date Attribute
and the person taking the survey is logged in then this attribute will be
updated to contain the date and time they took the survey.
Finally, you can set some Survey Instruction text that will display above the survey
questions when taking the survey. This is optional but is recommended so that
the user knows exactly what to do and what survey they are taking. When the
user submits the survey the Survey Complete Template text will be displayed.
There are a number of Lava variables available which are elaborated on
further down.
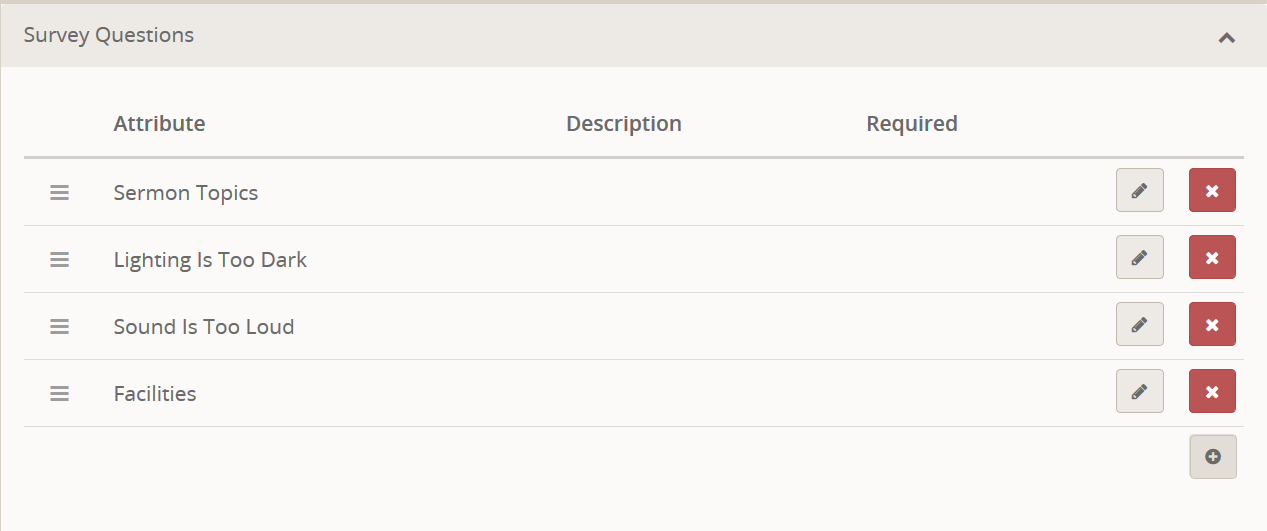
Here is where you will define the questions that will be asked of the user. Any field type can be used, though there are probably some that will not make much sense to use, such as the Group Picker. Rather than chew up a bunch of screen space with pictures of each question I will outline their setup below.
-
Sermon Topics
- Key = SermonTopics
- Field Type = Single-Select
- Values = Finances, Marriage, Raising Children
- Control Type = Drop Down List
- Show in Grid = Yes
-
Lighting Is Too Dark
- Key = LightingIsTooDark
- Field Type = Boolean
- True Text = Yes
- False Text = No
-
Sound Is Too Loud
- Key = SoundIsTooLoud
- Field Type = Boolean
- True Text = Yes
- False Text = No
-
Facilities
- Key = Facilities
- Field Type = Multi-Select
- Values = Larger Classrooms, More One-on-One time in childcare, Cleaner Restrooms, Softer Toilet Paper
As usual, the Name is what is displayed to the user on the survey entry page as the title of that field. If you enter a Description it will be used as the help text bubble. You can set a Default Value if you want and it will be used like normal.
The Show in Grid option will make the answer show up when viewing the
list of results, and also allow you to filter answers by that attribute.
This is only used when setting up a test instead of a survey, so for now we are just going to leave it off and discuss it later.
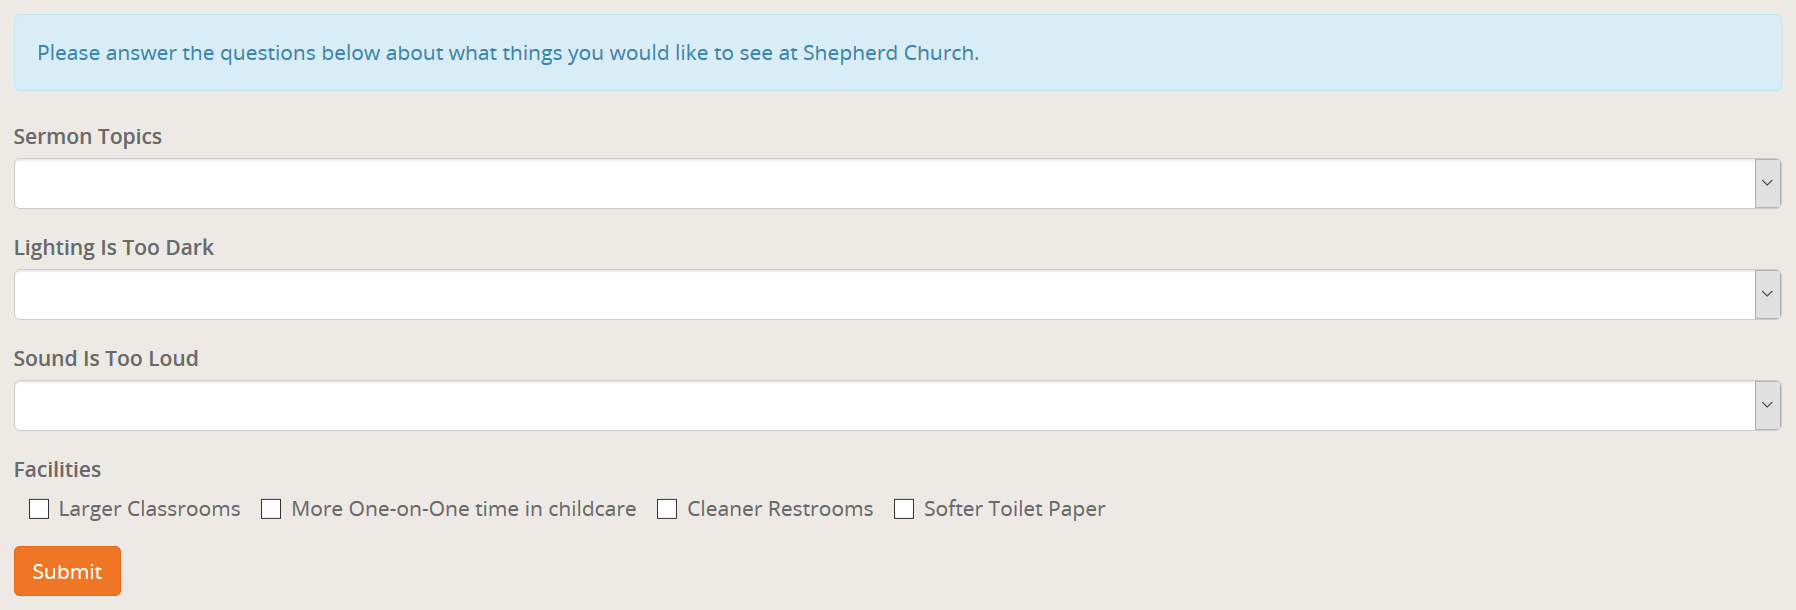
There isn't much to say here. This is what the survey we have built looks like when we take it by clicking the Run button.
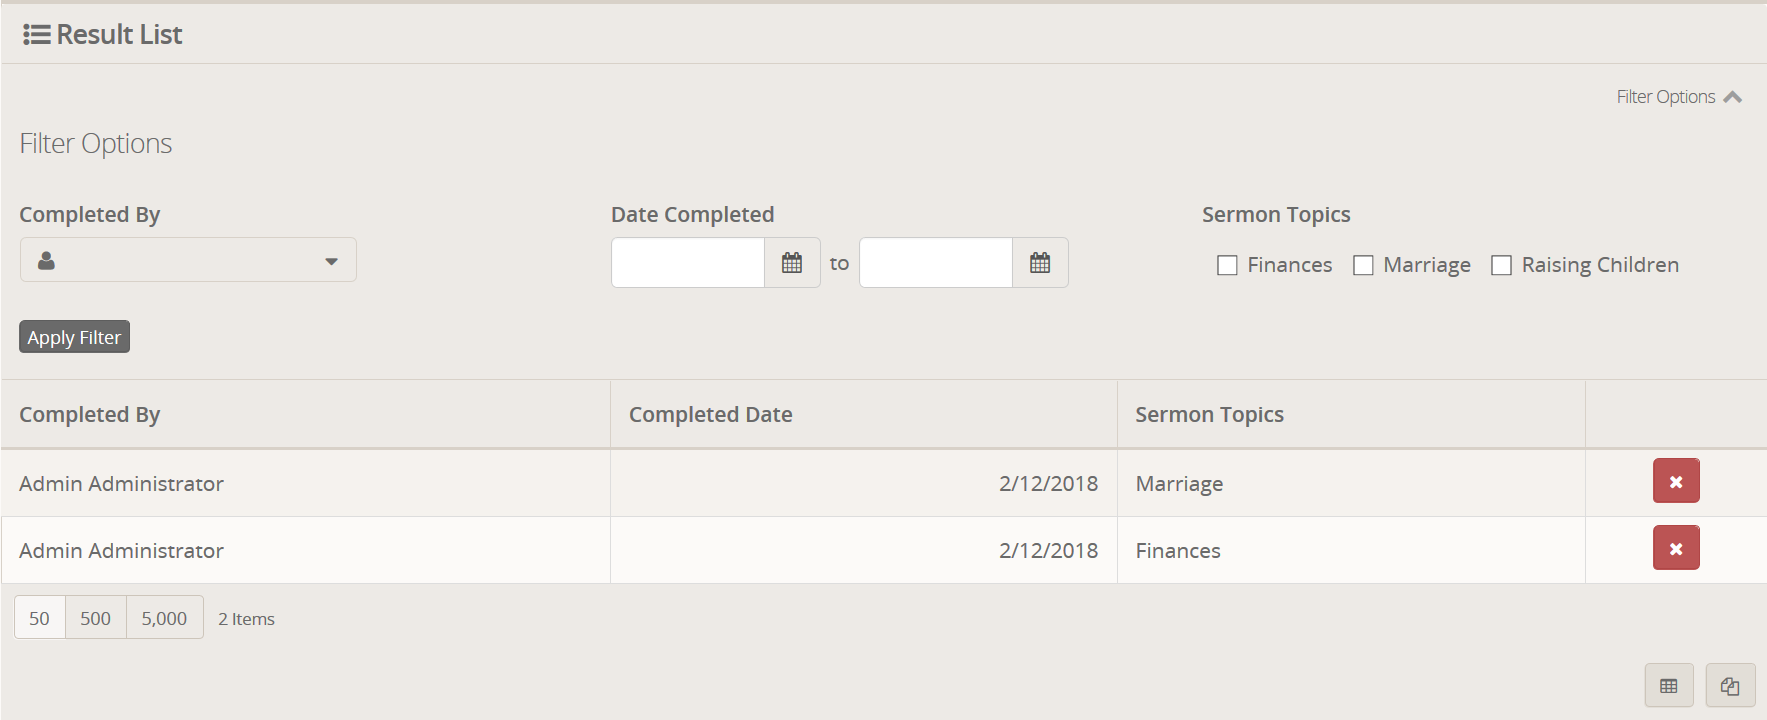
As you can see, when viewing the list you can filter by the person that completed the survey as well as when it was completed. Any questions that were marked as Show on Grid will also be options to filter by. When exporting the results the Excel file will include all question fields, not just the ones that are currently displayed. This means you can export the entire list and use Excel to tally up total selections.
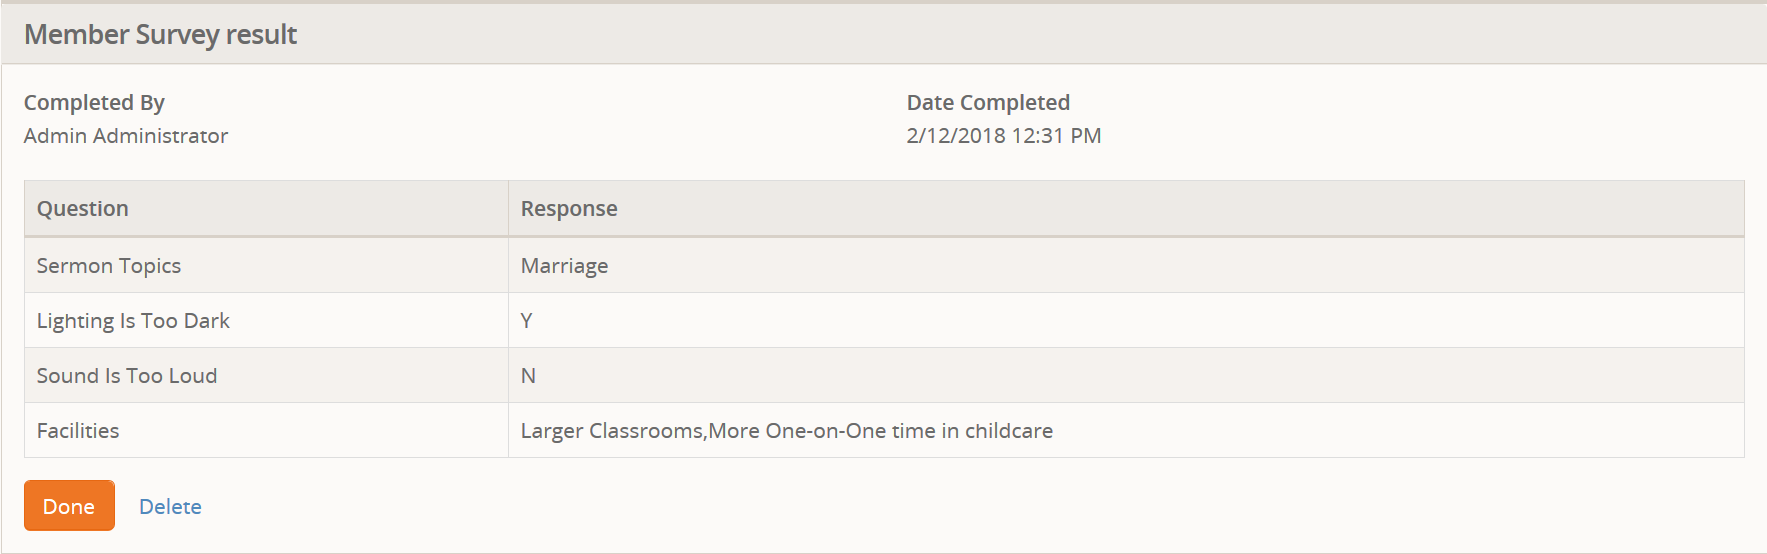
Clicking on a single item will allow you to view the specific details about that result. Every question and answer.
When you are looking at the list of results, you will notice a small "charts" button in the top right corner. If you click on it you will be taken to a page that displays the results by using charts and graphs. For example, if you have a Single-Select question in your survey, then you can see at a glance which answer was selected the most.
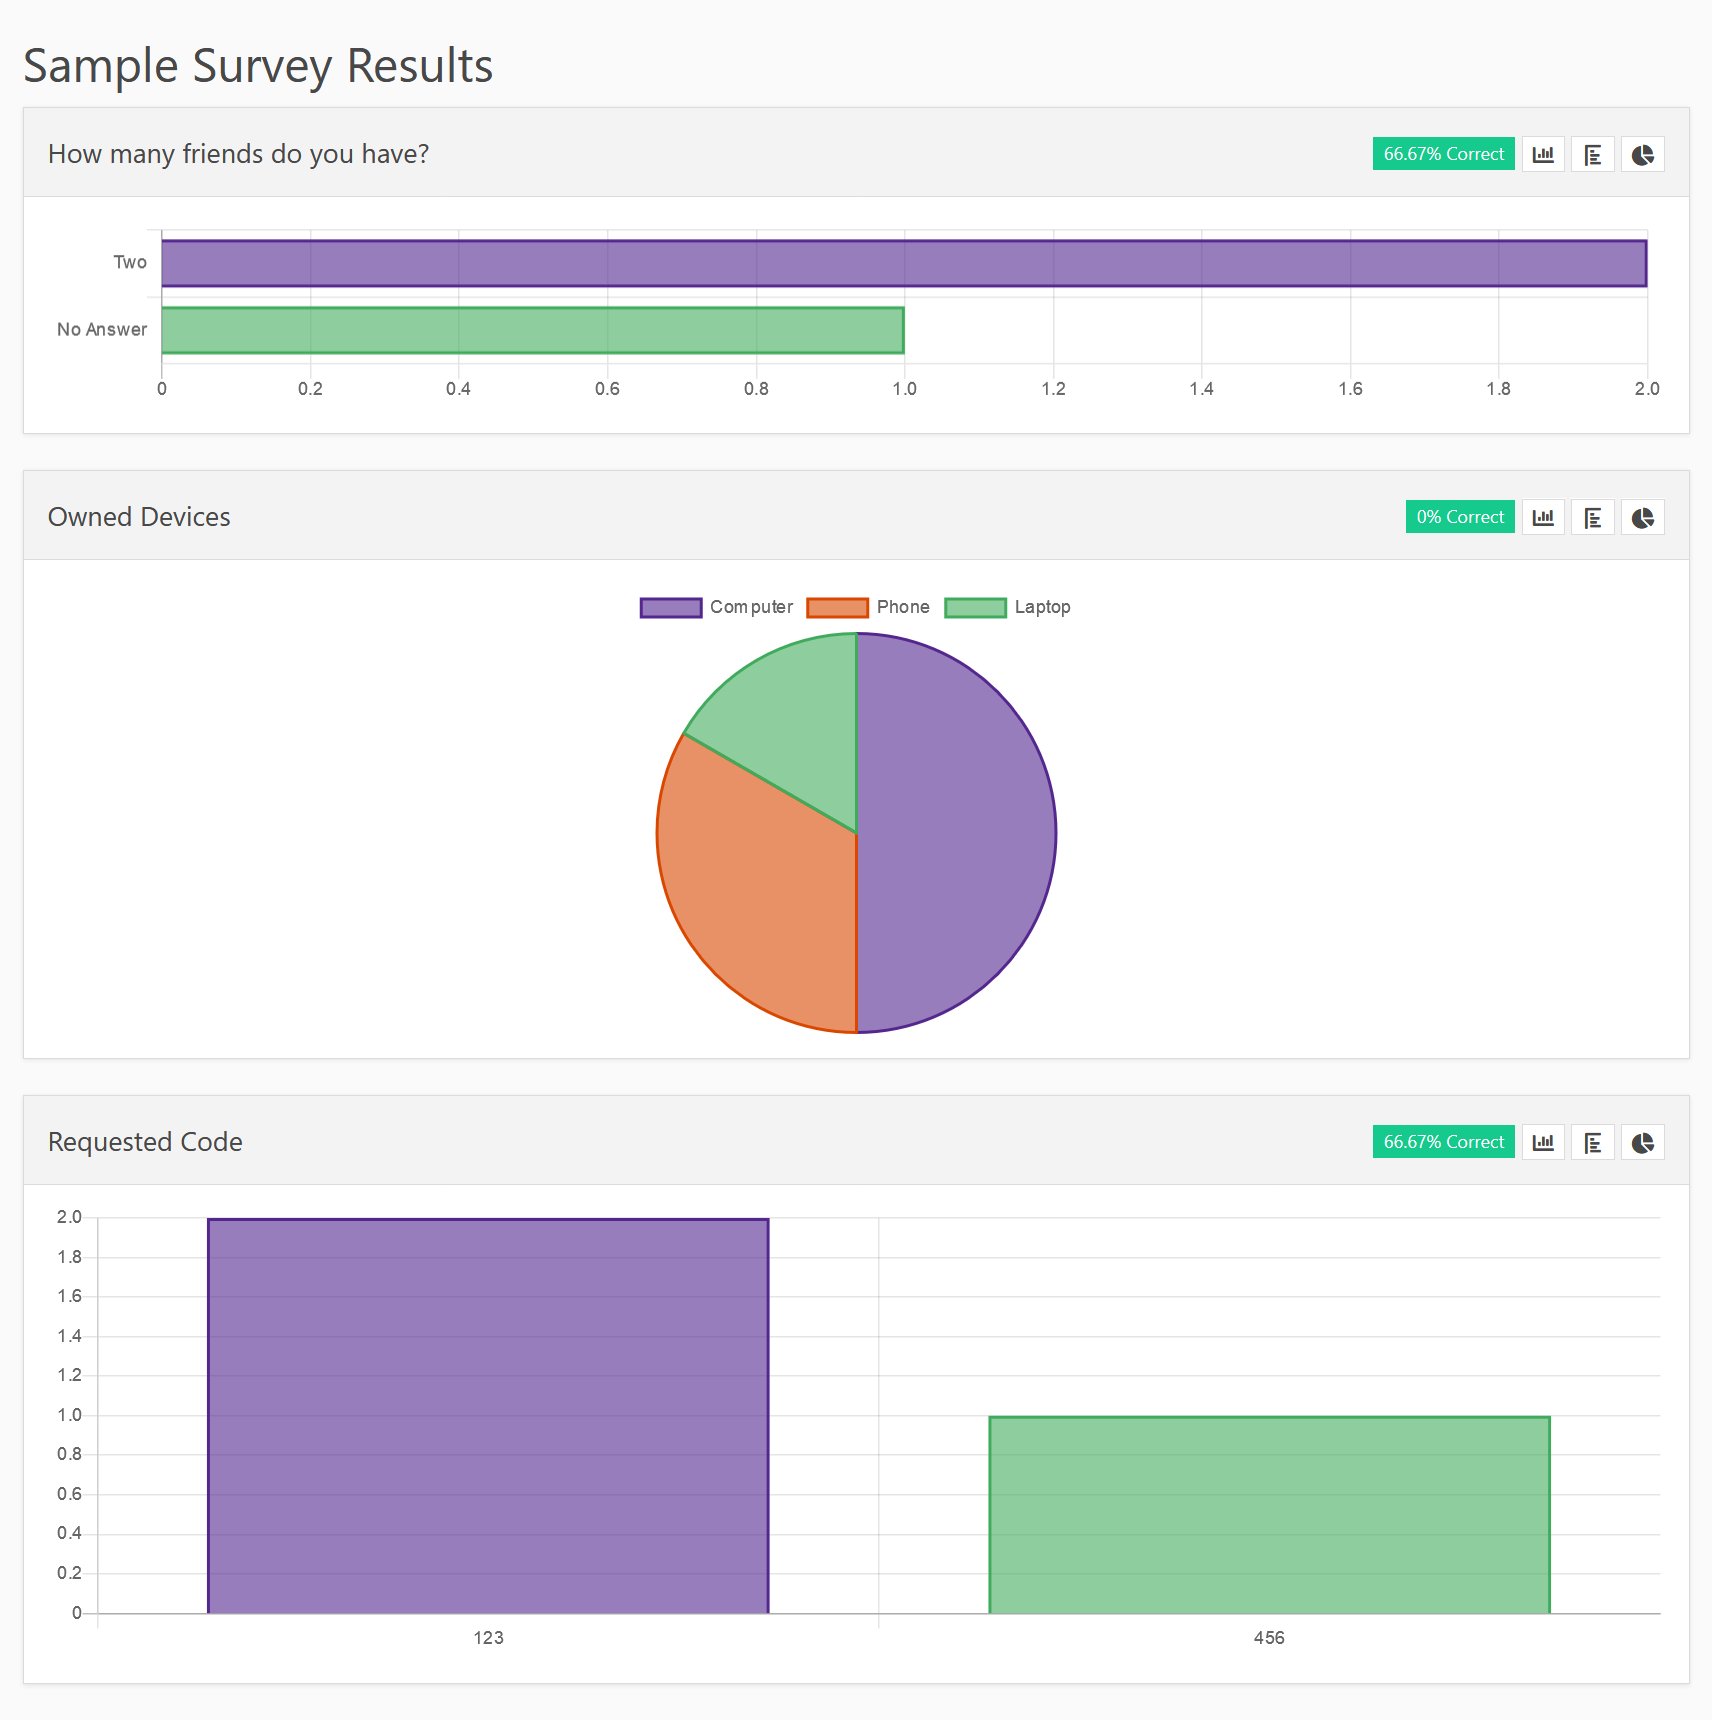
Each question gets it's own panel. In the header of each panel are buttons that allow you to pick how the results are displayed with various chart types.
Starting with version 2.0 of the plugin, you can configure a workflow on the survey that will be run for every completed survey. Configuring a workflow this way provides a few additional features over using the standard Rock workflow triggers.
- Easier to configure.
- Additional workflow attributes are automatically set if available.
- Works even if
Record Answersis turned off.
So first, about the information passed to the workflow. The Survey Result object
is passed as the Entity to the workflow. This means you must use the Set Attribute from Entity action to access it's values. Additionally, the following attribute
values will be set (matching based on the attribute Key, not the attribute Name):
-
Survey=> The survey object that was taken (this should be defined as a Survey field). -
CorrectAnswers=> A comma delimited list of the key names for the correct answers. -
IncorrectAnswers=> A comma delimited list of the key names for the incorrect answers.
A very simple Lava Template for the Set Attribute from Entity action might look like this:
Hello,

{{ Workflow | Attribute:'Person','FullName' }} has just completed the survey {{ Workflow | Attribute:'Survey','Name' }}.

Answers:
Question 1: {{ Entity | Attribute:'Question1' }}
Question 2: {{ Entity | Attribute:'Question2' }}
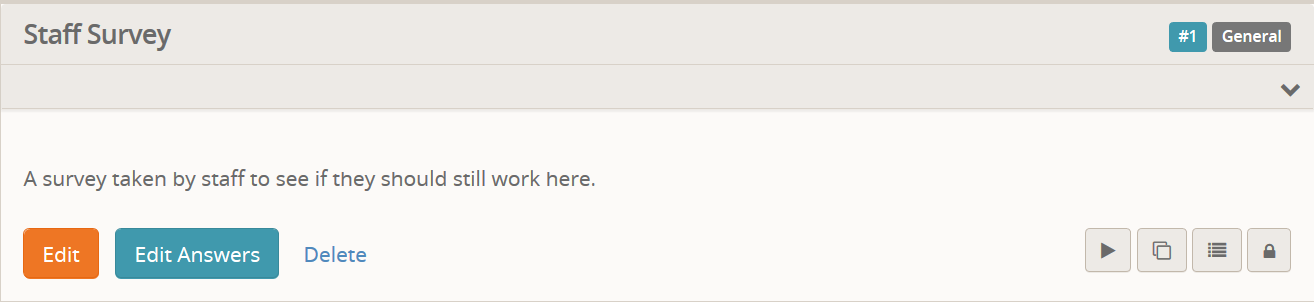
So we covered a basic survey. We are going to add some new features by implementing a new survey in test mode. I'll skip over some things that we already covered previously, so be sure to review the section above.
If you notice in the image above, there is a new button called
Edit Answers. This is an indication that the survey is in test mode and
allows you to edit the answers (covered later).
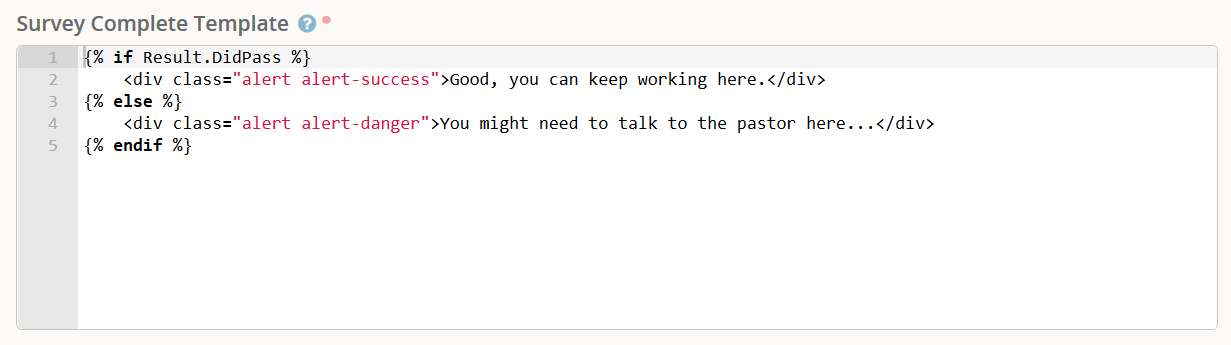
Since we already covered the rest of the fields, we'll just briefly touch
on the Survey Complete Template field and give you the example above to
show how to tell if they passed or failed the survey.
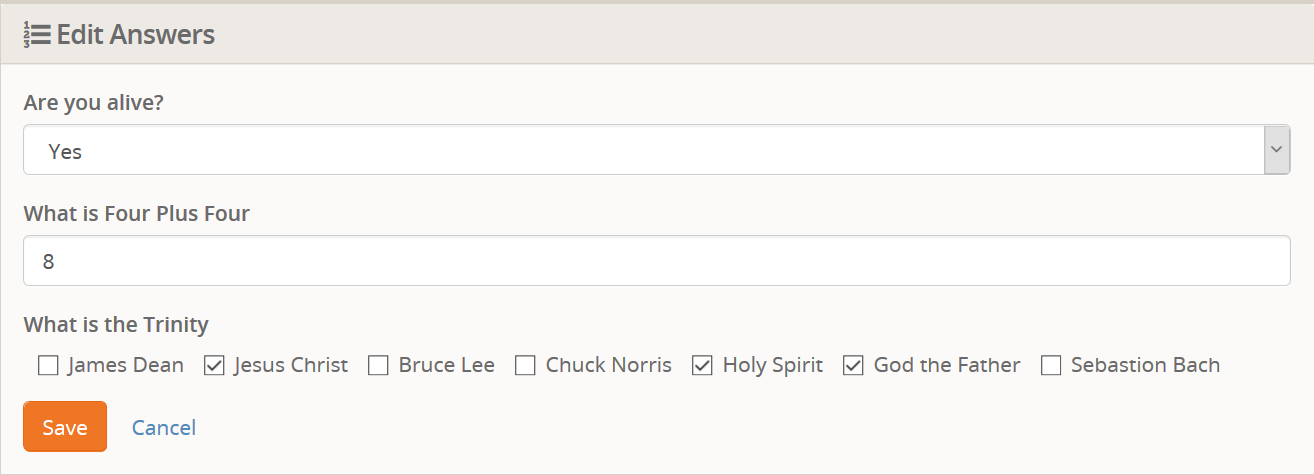
Here are the questions we will be asking on this survey:
-
Are you alive?
- Key = Areyoualive
- Field Type = Boolean
- True Text = Yes
- False Text = No
- Show in Grid = Yes
-
What is Four Plus Four
- Key = WhatisFourPlusFour
- Field Type = Integer
-
What is the Trinity
- Key = WhatistheTrinity
- Field Type = Multi-Select
- Values = James Dean, Jesus Christ, Bruce Lee, Chuck Norris, Holy Spirit, God the Father, Sebastion Bach
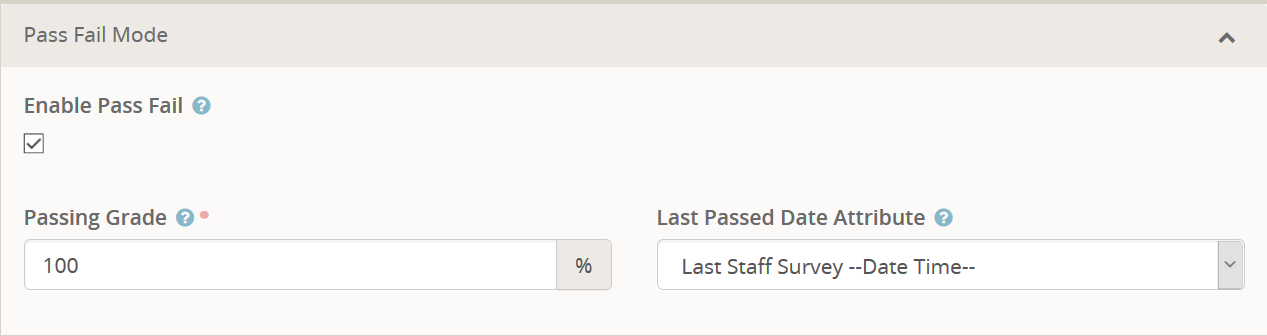
When you enable Pass Fail Mode you need to specify the Passing Grade
percentage that they must answer correctly to be marked as passing the
test. Additionally, you can set a Last Passed Date Attribute. Like the
Last Attempt Date Attribute, this attribute is set automatically if the
person is logged in. But, it is only set to the current date and time if
the person actually passes the test.
This allows you to determine when the last time was that somebody passed a test to know if they need to retake it. For example, if you have all staff take a "test" every 18 months to make sure they are aware of certain staff rules and regulations. Such as how to handle credit cards, anything to do with children, etc. You can simply setup a Data View and configure it to show everybody who is a staff member but has the attribute specified here does not contain a date within the past 18 months.
As we mentioned, when looking at the survey when it is in Test Mode you
will have a new button called Edit Answers. Clicking this button will
allow you to set the correct answers.
Note: You cannot pick some questions to be in test mode and some not. So if you are going to have essay style answers they will always be considered to be incorrect.
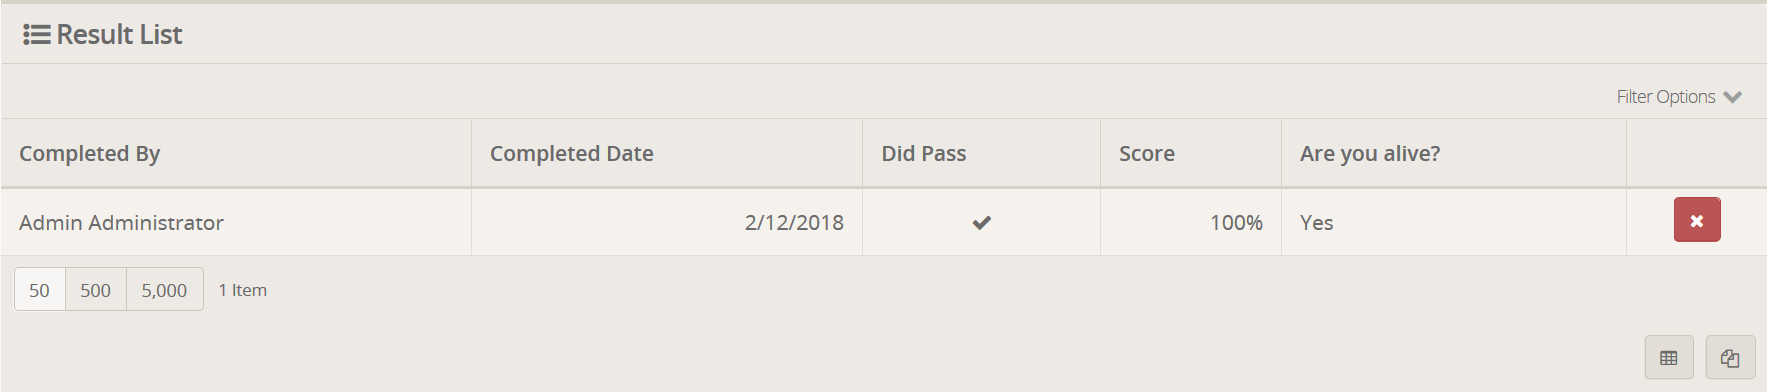
The only difference between this result list and the one we covered above
is the addition of the Did Pass and Score columns. These show, as you
would expect, whether or not the test was passed and their score.
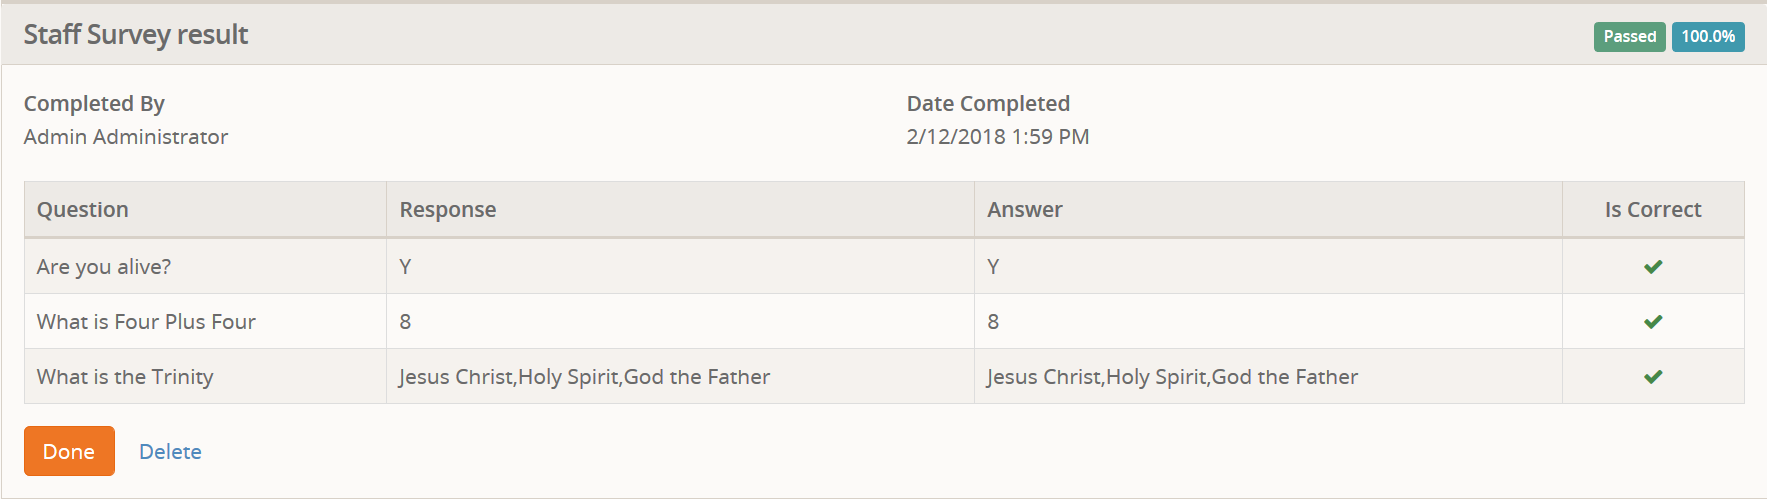
Clicking on a single item will allow you to view the specific details about that result. Every question and answer. In addition to the normal details you will also see in the top right corner whether they passed and what their score was.
When designing your Survey Instructions you have a number of things
available to you in addition to the common merge fields like CurrentPerson.
{
  "Survey": {
    "Name": "Staff Survey",
    "Description": "A survey taken by staff to see if they should still work here.",
    "PassingGrade": 100.0,
    "CategoryId": 991,
    "InstructionTemplate": "...",
    "ResultTemplate": "...",
    "LastAttemptDateAttributeId": null,
    "LastPassedDateAttributeId": 11920,
    "RecordAnswers": true,
    "IsActive": true,
    "Id": 1,
    "Guid": "d71226a4-43de-4d77-8400-5f22e449f605"
  }
}
When designing your Survey Complete Template you have a number of things
available to you in addition to the common merge fields like CurrentPerson.
{
  "Survey": {
    "Name": "Staff Survey",
    "Description": "A survey taken by staff to see if they should still work here.",
    "PassingGrade": 100.0,
    "CategoryId": 991,
    "InstructionTemplate": "...",
    "ResultTemplate": "...",
    "LastAttemptDateAttributeId": null,
    "LastPassedDateAttributeId": 11920,
    "RecordAnswers": true,
    "IsActive": true,
    "Id": 1,
    "Guid": "d71226a4-43de-4d77-8400-5f22e449f605"
  },
  "Result": {
    "SurveyId": 1,
    "TestResult": 33.333333333333333333333333330,
    "DidPass": false
  }
  "CorrectAnswers": [
    "Areyoualive"
  ],
  "IncorrectAnswers": [
    "WhatisFourPlusFour",
    "WhatistheTrinity"
  ],
  "Answers": {
    "Areyoualive": "True",
    "WhatisFourPlusFour": "6",
    "WhatistheTrinity": "James Dean,Bruce Lee,Chuck Norris,Sebastion Bach"
  }
}