This repo contains the slides and abstract for the ePoster presented at Rstudio::conf 2019. I've also adapted some of the material from the presentation in to markdown below.
We introduced two R packages for use in clinical trial research: safetyGraphics and datadigest. You can try them using the following code:
# safetyGraphics demo
install.packages("safetyGraphics")
library("safetyGraphics")
safetyGraphicsApp()

# datadigest demo
install.packages("datadigest")
library("datadigest")
explorer(demo = TRUE)
Read on for more details!
Clinical trial research is highly regulated and notoriously slow moving. As a result, modern data analysis tools and techniques that have become commonplace in other industries have struggled to achieve broad or consistent adoption. This presentation introduces three R packages that allow clinical trial researchers to interact with their data using tools that are free, reproducible, customizable, and easy to use. The packages combine JavaScript-based interactive graphics with a flexible R data pipeline built for existing clinical data standards. This flexible technical framework, combined with an open source development workflow in GitHub, may provide a useful road map for creating similar tools in other change-resistant environments.
- Clinical trial research is highly regulated and notoriously slow moving.
- Manual review of huge data listings is still common.
- Existing analysis tools are expensive, difficult to customize and tend to use proprietary formats, limiting reproducibility.
We're working to create interactive tools that are:
- Open Source - Transparent. Customizable. Free!
- Interactive - Users can explore their data.
- Easy to Use - Just open up a webpage.
- Easy to Configure - Streamlined configuration with R.
- Compliant with Data Standards - Support ADaM and SDTM by default.
- Highly Collaborative - Clinicians and Programmers working together.
- Agile - Frequent releases with GitHub.
- Engaging - Regular Feedback from users. Pilot testing. Open issue tracking.
Both safetyGraphics and datadigest were created using these principles and are available now.
The safetyGraphics and datadigest repos were created using the "solutions" described above and are available now.
The safetyGraphics R package that allows users to evaluate clinical trial safety in R. These specialized graphics use lab data from clinical trials (AdAM or SDTM preferred). To learn more you can:
- See the package on CRAN
- View the vignette for detailed guidance on using the Shiny application
- Explore the github repo for the package
- Check out the underlying javascript library used to create the eDish Chart
- Try out a hosted version of the shiny app (or run it locally using the code in the capsule summary above)
- Check out more interactive graphics for safety monitoring. We also wrote a paper about these. Our plan is to add some of them to SafetyGraphics package in future releases.
- Take a look at the technical framework being used to create the chart
- See the Shiny App in action below:
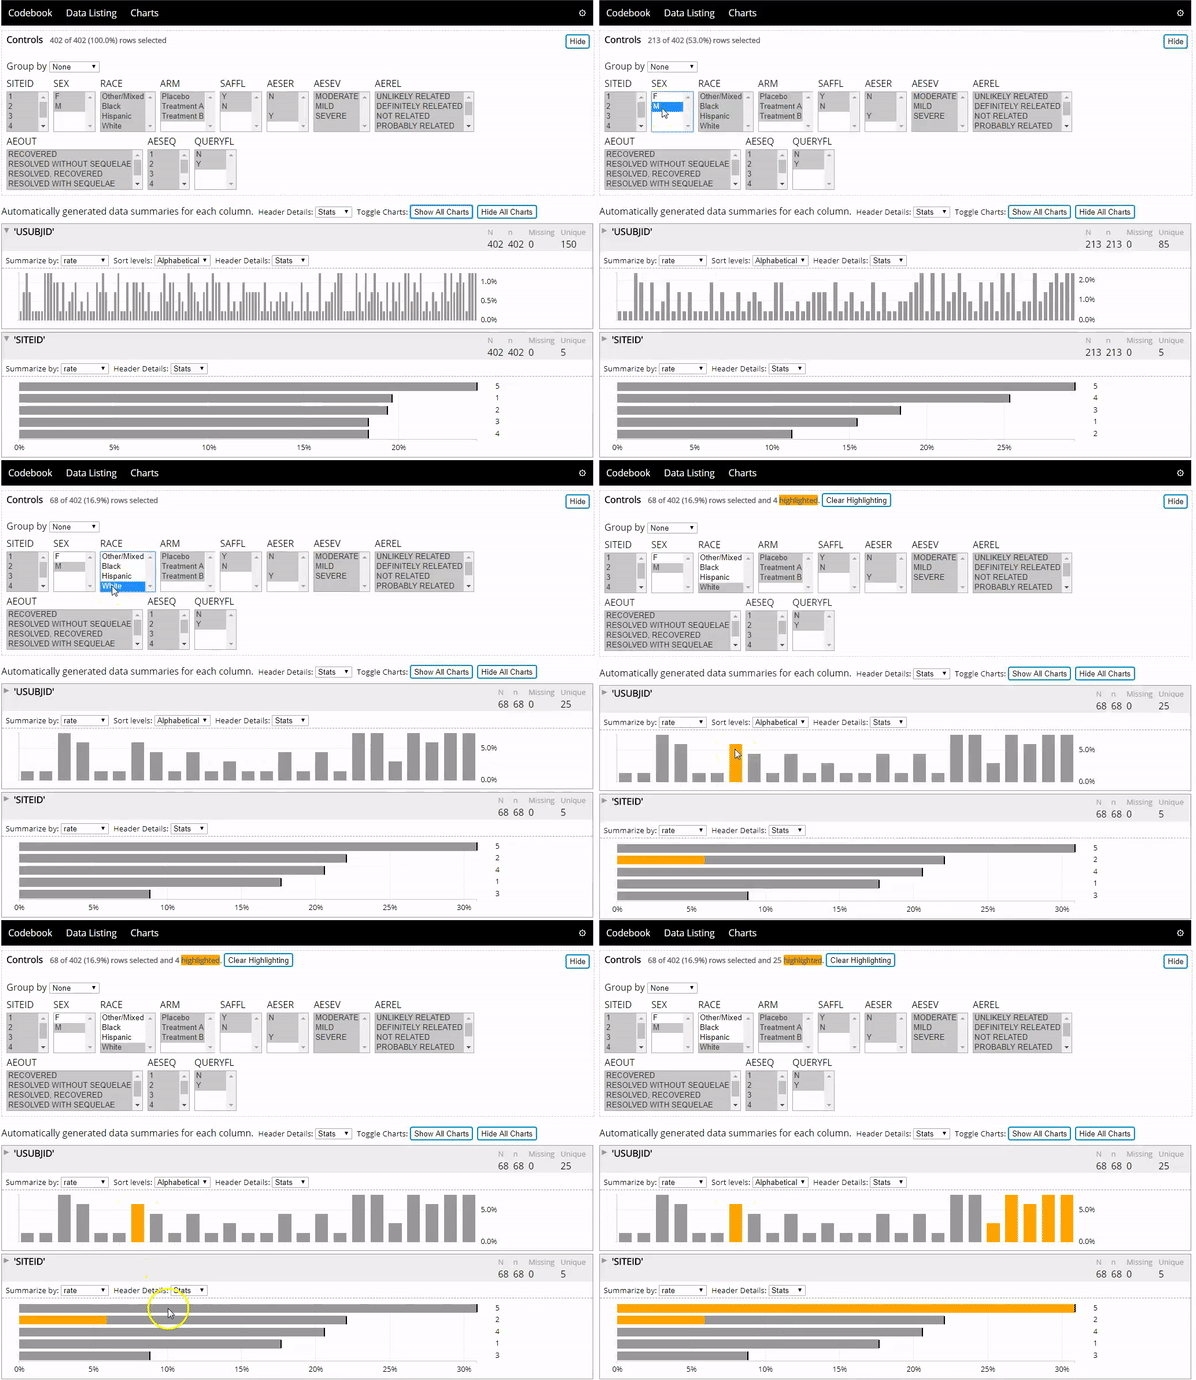
The datadigest R package creates concise interactive data summaries in R. We think this package is great for reviewing clinical trial data, but it works great with any other data domain as well and requires no configuration for most data. To learn more you can:
- Explore the github repo for the package
- Check out the underlying javascript library used to create the graphics.
- See the package in action below:
Jeremy Wildfire presented the poster. You can reach him at [email protected] with questions or comments. The full author list (with github ids) is: Jeremy Wildfire (@jwildfire), Rebecca Krouse (@bzkrouse), Preston Burns (@pburnsdata), Ryan Bailey(@rtbailey), Spencer Childress (@samussiah), Susan Duke (@spduke), James Buchanan (@JimBuchanan), Xiao Ni (@xni7), Frank Harrell (@harrelfe)
The safetyGraphics and safety-edish projects are maintained by the ASA Biopharm/DIA Safety Working Group’s Interactive Safety Graphics Taskforce, which combines stakeholders from across the pharmaceutical industry, including the FDA. All other work done by The Center for Interactive Data Visualization at Rho. All work is free and open source with an MIT License. Author Affiliations are as follows with an astericks indicating Safety Graphics Taskforce members: J Wildfire (Rho*), Rebecca Krouse (Rho*), Preston Burns (Rho), Ryan Bailey (Rho), Spencer Childress (Rho), Susan Duke (FDA*), James Bucanan (Covilance*), Xiao Ni (Novartis*), Frank Harrell (Vanderbilt*)

