As the developer of this integration I would suggest using MTrab/energidataservice. Energidataservice also works with NRGI in addition to other providers. It offeres more options and is more actively maintained. This integration only has a subset of the features that Energidataservice has to offer.
This integration is not affiliated with NRGI.
NRGI is a danish energy company that provides electricity and gas to private and business customers. The company acts like a Distribution System Operator (DSO) and is responsible for the distribution of electricity and gas to the end customer.
NRGI offers a variable-rate tariff for electricity. The variable-rate can be used to reduce the electricity bill by using electricity when the price is low. The price can be found on the NRGI website here: https://nrgi.dk/privat/stroem/bliv-klogere-paa-stroem/foelg-timeprisen-paa-stroem.
This API lets you see the variable-rate prices for the next 48 hours. Which can be used to let you know when to use power hungry devices.
This card is available in HACS (Home Assistant Community Store). HACS is a third party community store and is not included in Home Assistant out of the box.
To display the variable-rate prices in Lovelace, you use the ApexCharts card. The ApexCharts card is a custom card that can be installed using HACS. The card can be found here: https://github.com/RomRider/apexcharts-card.
type: custom:apexcharts-card
graph_span: 24h
header:
  title: Energy price today (dkk/kWh)
  show: true
span:
  start: day
now:
  show: true
  label: Now
apex_config:
  yaxis:
    min: 0
    max: 4 # If you want the y-axis to be fixed at 4 dkk/kWh
series:
  - entity: sensor.nrgi_price_dk1
    type: column
    data_generator: |
      return entity.attributes.raw_today.map((start, index) => {
        return [new Date(start["start"]).getTime(), start["value"]];
});type: custom:apexcharts-card
graph_span: 24h
header:
title: Energy price tomorrow (dkk/kWh)
show: true
span:
start: day
offset: +1d # Used to offset the start of the graph by 1 day
now:
show: true
label: Now
apex_config:
yaxis:
min: 0
max: 4 # If you want the y-axis to be fixed at 4 dkk/kWh
series:
- entity: sensor.nrgi_price_dk1
type: column
data_generator: |
return entity.attributes.raw_tomorrow.map((start, index) => {
return [new Date(start["start"]).getTime(), start["value"]];
});When can I see the prices for the next day?
The prices for the next day is available at 15:00. This is when NRGI updates the prices for the next day.
Which region should i pick?
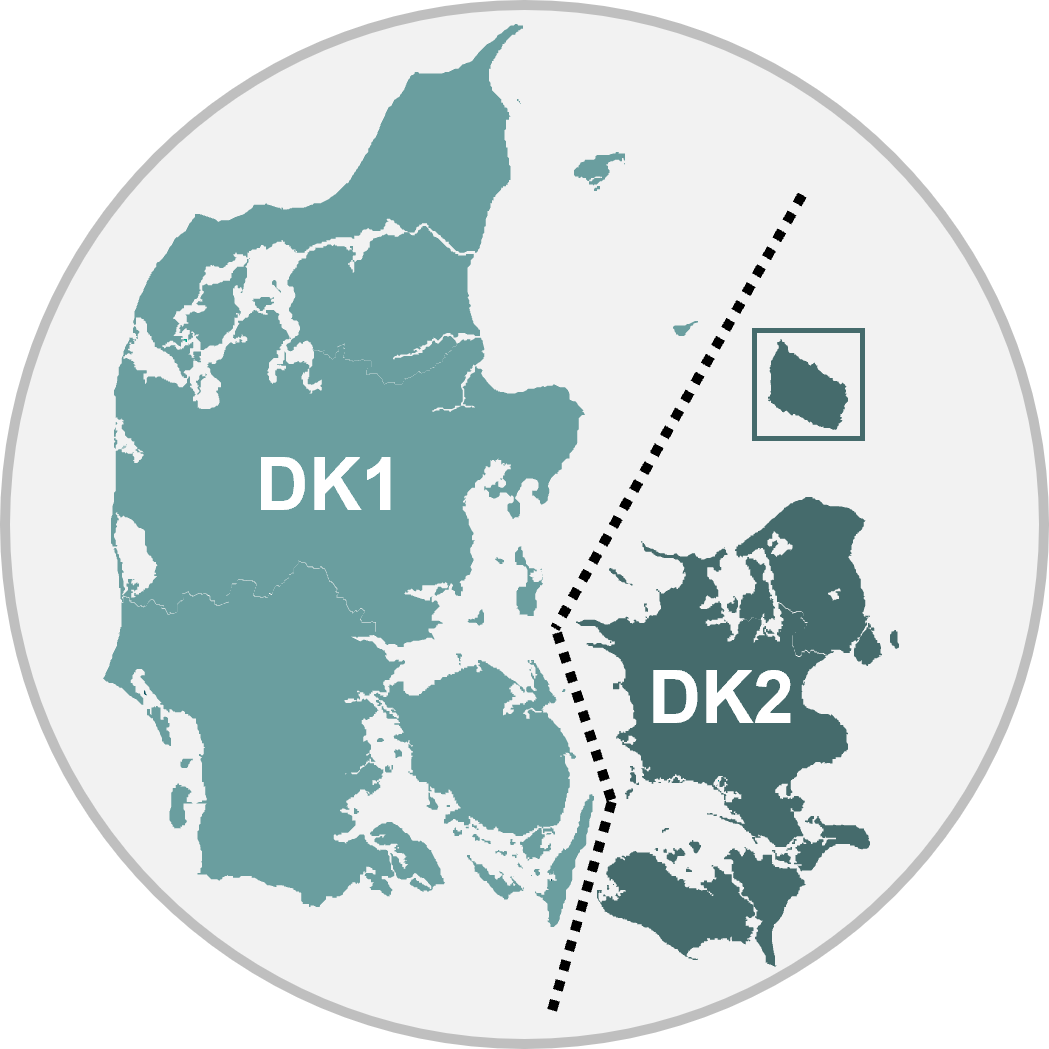
The region is the area where you live. DK1is west part of denmark and DK2 is the east part of denmark.


