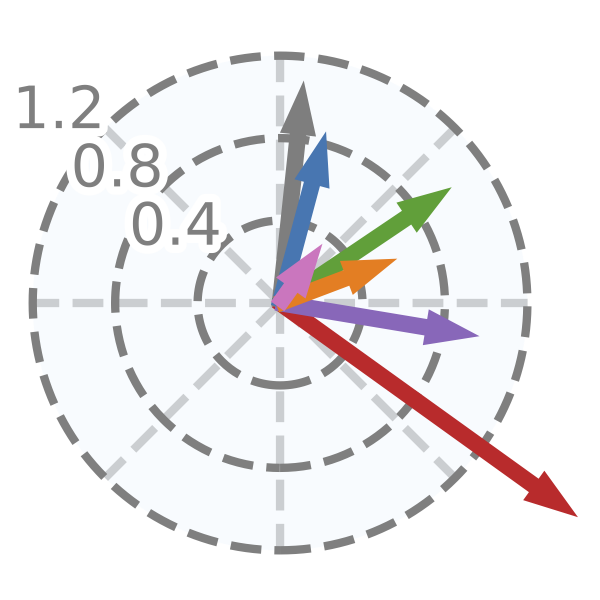
It is difficult for humans to perceive high-dimensional data. Therefore, high-dimensional data is projected into lower dimensions to visualize it. Many applications benefit from complex nonlinear dimensionality reduction techniques (e.g., UMAP, t-SNE, PHATE, and autoencoders), but the effects of individual high-dimensional features are hard to explain in the latent spaces. Most solutions use multiple two-dimensional plots to analyze the effect of every variable in the embedded space, but this is not scalable, leading to k plots for k different variables. Our solution, Feature Clock, provides novel visualizations that eliminate the need for multiple plots to inspect the influence of original variables in the latent space. Feature Clock enhances the explainability and compactness of visualizations of embedded data.
Feature Clock allows creation of three types of static visualizations, highlighting the contributions of the high-dimensional features to linear directions of the two-dimensional spaces produced by nonlinear dimensionality reduction:
- Global Feature Clock indicating the direction of features’ contributions in low-dimensional space for the whole dataset.
- Local Feature Clock explaining features’ impact within selected points.
- Inter-group Feature Clock visualizing contributions between groups of points.
The source code is currently hosted on GitHub at: https://github.com/OlgaOvcharenko/feature_clock_visualization.git
Binary installers for the latest released version are available at the Python Package Index (PyPI).
# PyPI
pip install feature-clockFeature Clock can be installed from PyPI:
pip install feature-clockAll dependencies are listed in requirements.txt and can be installed separately.
pip install -r requirements.txtThere is documentation, and a simple tutorial.
