-
Notifications
You must be signed in to change notification settings - Fork 4
Home
#HiTSelect user guide
 Aaron Diaz [email protected]
HiTSelect is a software for the deconvolution and analysis of high-throughput, pooled, genetic screens. It is designed for screens which use next-generation sequencing as readout. HiTSelect provides modules for identifying screen hits via rigorous statistics, visualizing screen readout and performing downstream functional and network analysis. This document is a brief guide to using the software and interpreting its results. If you find this software useful please cite Diaz A., Qin H., Ramalho-Santos M., Song J. “HiTSelect: A Comprehensive Tool for High-Complexity Pooled Screen Analysis”. For software downloads and the sample data referred to in this guide see: https://sourceforge.net/projects/hitselect/ and for source code, wiki, bugs or requests see https://github.com/diazlab/hitselect/
#Table of contents
HiTSelect runs under most 64bit Mac OSX, Windows, and Linux distributions. It was compiled and tested under Mavericks, Windows 7 and Linux 3.2.0-4-amd64. It is recommended that you run HiTSelect on a computer with at least 4GB of memory. Start by downloading the appropriate installation package from: https://sourceforge.net/projects/hitselect/
Also, if you want to run the gene-hit network interaction module, you will need a GeneMANIA network database. You can obtain one, which we have tested with our code, by downloading the file gmdata.zip from:
https://sourceforge.net/projects/hitselect/files
HiTSelect is released under the GNU General Public License: http://www.gnu.org/licenses/. The HiTSelect source code can be obtained from https://github.com/diazlab/hitselect.
-
Decompress the HiTSelect archive
-
Unzip the file
HiTSelect_MacOS.zipby double clicking theHiTSelect_MacOS.zipicon. -
Open the folder
HiTSelect_MacOS/.
-
-
Install MCR, the MATLAB Compiler Runtime:
-
Unzip
MCRInstaller.zipby double clicking its icon -
Double click
InstallForMacOSX -
Follow the on screen instructions, but keep track of the install location if you change the default.
-
-
To start HiTSelect:
-
Double click the HiTSelect icon.
-
From the command line:
-
Navigate to the
CHANCE_MacOSfolder -
Execute
./run_chance.sh path_to_mcr, wherepath_to_mcris the path to the MCR you installed. The default path is/Applications/MATLAB/MATLAB_Compiler_Runtime/v717/
-
- If you do not have X11 installed already, you will be prompted to download and install it before you can start HiTSelect.
-
-
To install the optional GeneMANIA database, for use with the gene interaction module, download the file
gmdata.zipfrom: https://sourceforge.net/projects/hitselect/files. Unzip the file to a destination of your choice, but remember where you put it, you will need that information later.
-
Navigate to where you downloaded
HiTSelect_Linux.zip -
Decompress the HiTSelect archive
unzip HiTSelect_Linux.zip cd hit_select -
Install MCR, the MATLAB Compiler Runtime:
unzip MCRInstaller.zip
sudo ./install
Follow the on screen instructions, keep track of the install location if you change the default
-
To start HiTSelect:
./run_hts.sh path_to_mcrwherepath_to_mcris the path to the MCR you installed,the default is/usr/local/MATLAB/MATLAB_Compiler_Runtime/v80/ -
To install the optional GeneMANIA database, for use with the gene interaction module, download the file
gmdata.zipfrom: https://sourceforge.net/projects/hitselect/files. Unzip the file to a destination of your choice, but remember where you put it, you will need that information later.
-
Double-click the installer executable HiTSelect_Windows.exe, follow on screen instructions.
-
To start HiTSelect: double-click
hts.exe. -
To install the optional GeneMANIA database, for use with the gene interaction module, download the file
gmdata.zipfrom: https://sourceforge.net/projects/hitselect/files. Unzip the file to a destination of your choice, but remember where you put it, you will need that information later.
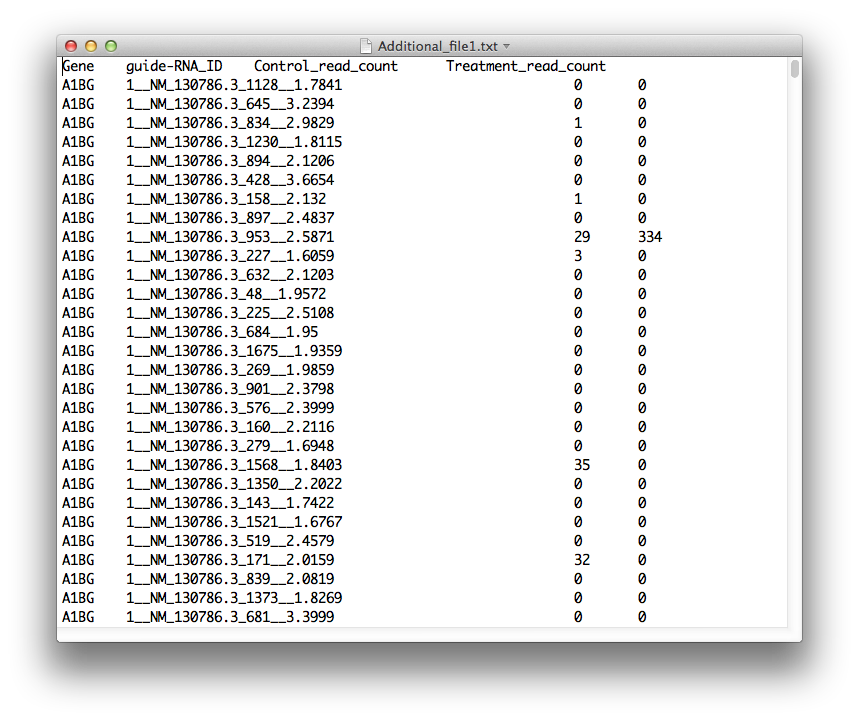
#Loading and saving data HiTSelect's main screen is where you can load screen readout and gene expression data. To load the screen's readout, prepare a tab-separated-values file with the format:
GENE_SYMBOL GUIDE_RNA_ID CONTROL_1 CONTROL_2 ... CONTROL_N TEST_1 TEST_2 ... TEST_M
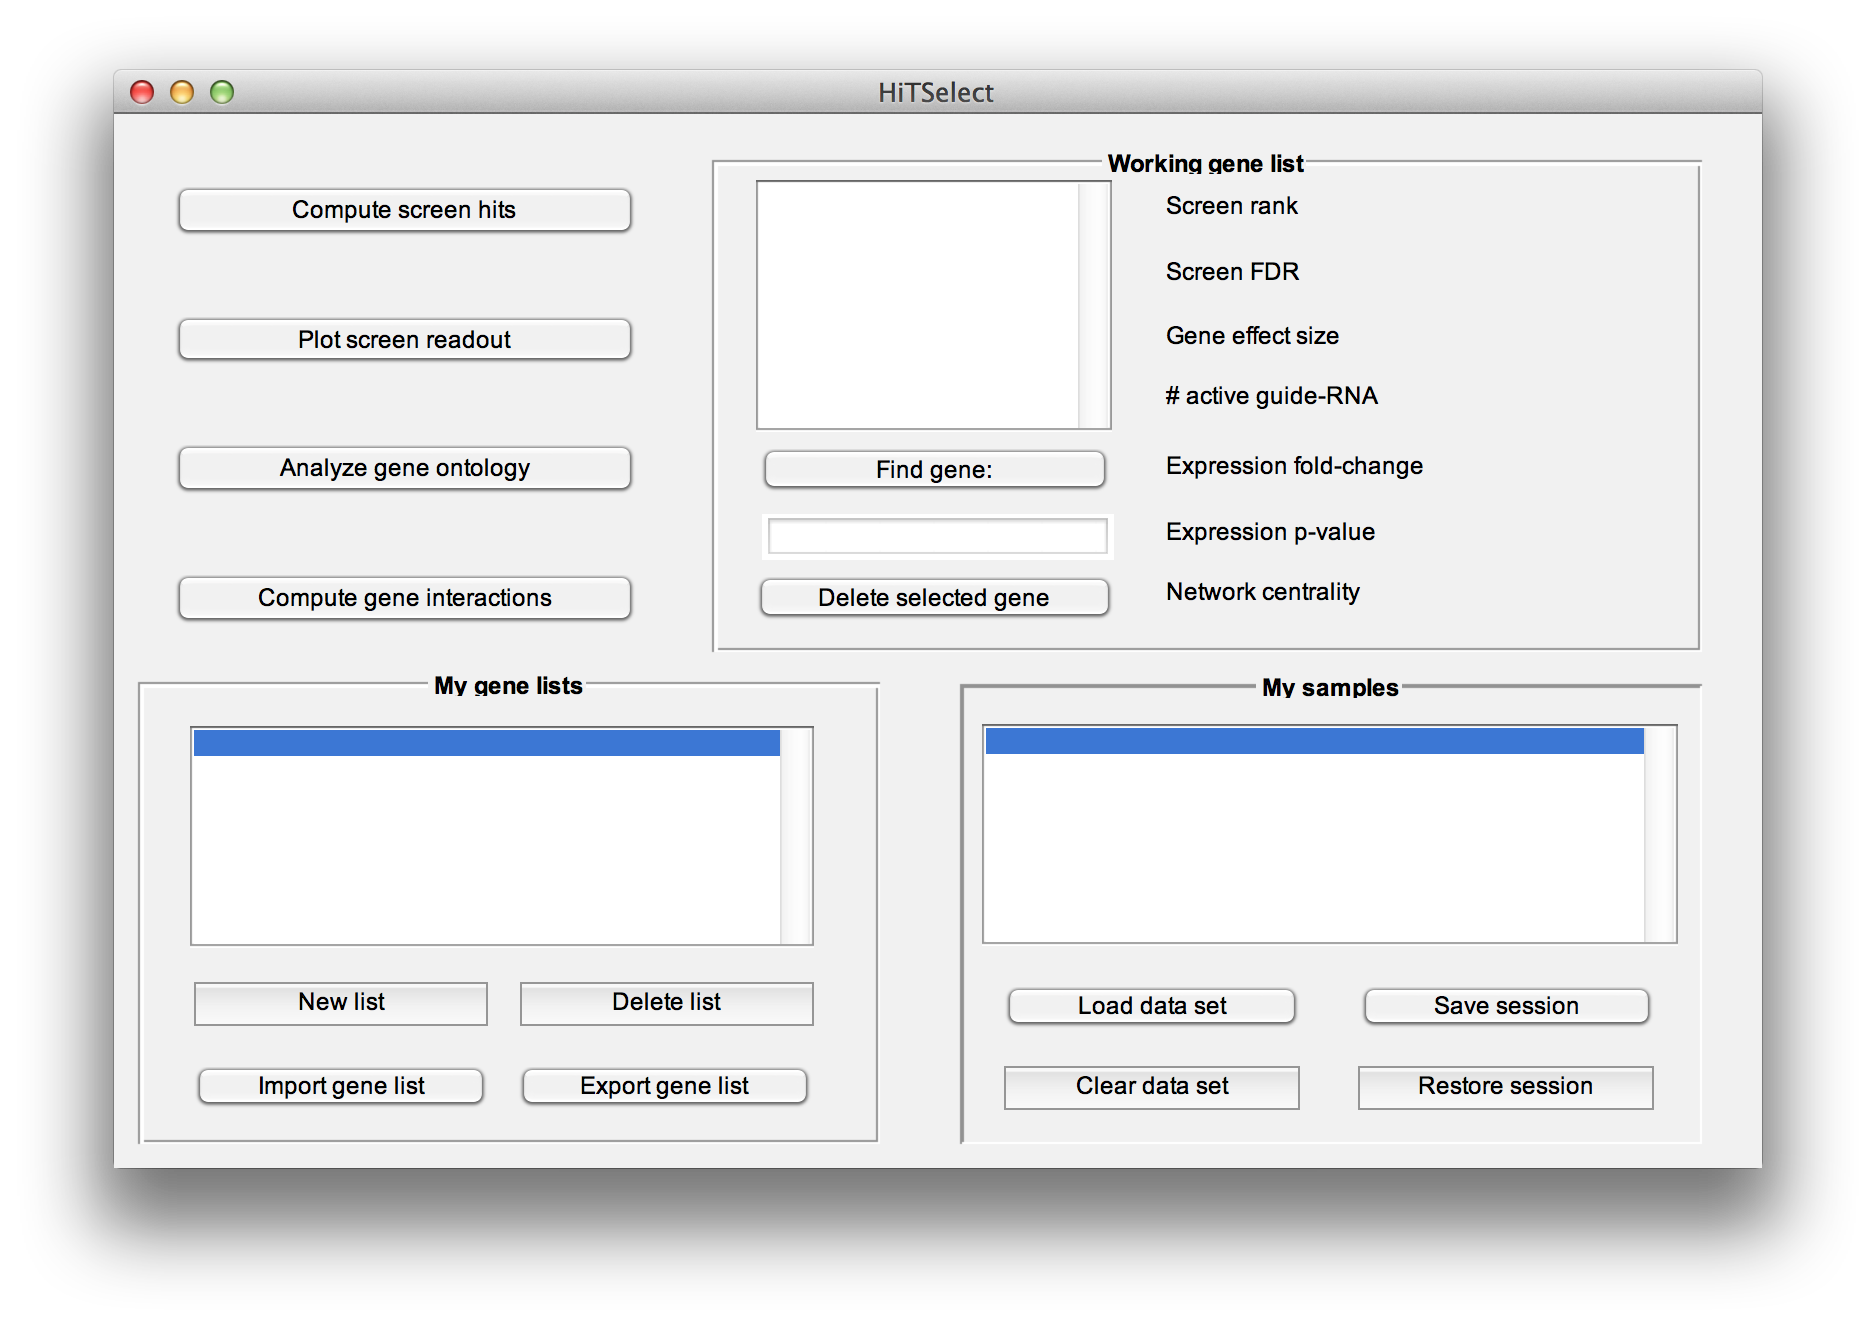
Where GUIDE_RNA_ID is a guide-RNA identifier, for a construct targeting gene GENE_SYMBOL. CONTROL_1,...,CONTROL_N are the read-counts for the guide-RNA's barcode from the N replicates of the control experiment. Likewise, TEST_1,...,TEST_M are read-counts for the guide-RNA's barcode, from the test population replicates. Additionally, the file must have a single header line, which can be any string you like. An example:
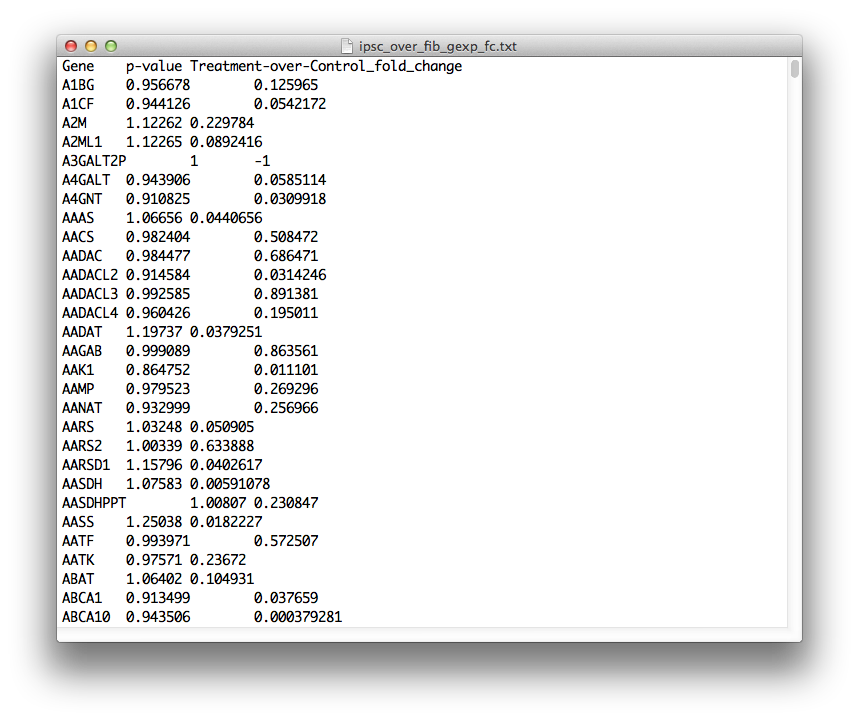
On the other hand, the file format for the input of gene expression data is:
GENE_SYMBOL P_VALUE FC
FC stands for gene expression, treatment-over-control fold change. If you have a gene in the screen for which you don't have expression data, place 1 for the p-value and -1 for the fold-change. Additionally, the file must have a single header line, which can be any string you like. The gene expression data is optional, and it won't be used to compute screen hits. But, if you have relevant differential gene expression data for your system, then HiTSelect will annotate your genes with it in each of the analysis modules, which is useful. Make sure the gene symbols match those you used for the screen readout.
To load these files, press the "Load Data" button. At the load data dialogue, select the type of data to load, the species, and enter the number of replicates (only if you are loading screen readout). The species information is only used by the "Analyze gene ontology" module. You can still compute hits and use the other module for screens in other species not listed.
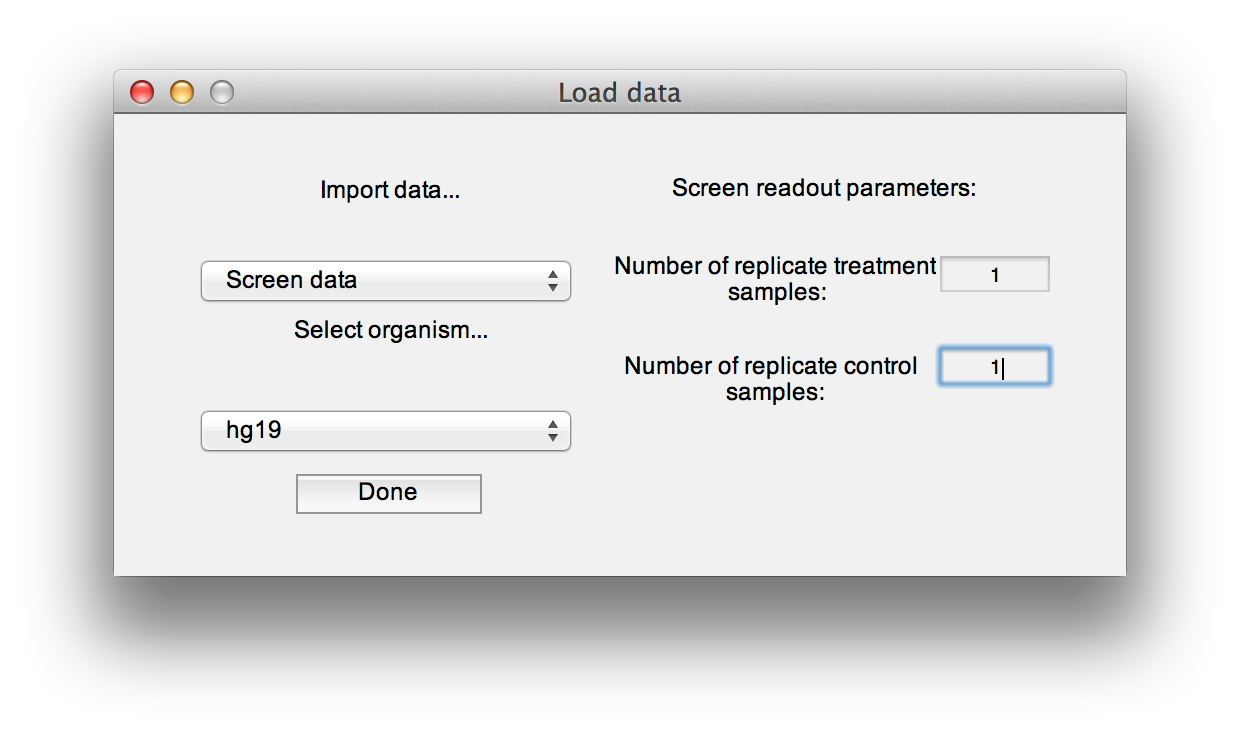
Use the "Restore session" and "Save session" buttons to write session data to file and read it in again later, without recomputing screen hits, network centrality or repopulating working gene lists.
#Working with gene lists HiTSelect is designed to work with gene lists. Each of HiTSelect's modules can be used to generate lists of interesting genes which can then be passed to other modules, edited or printed to file. The working gene list box can be used to curate a given list.
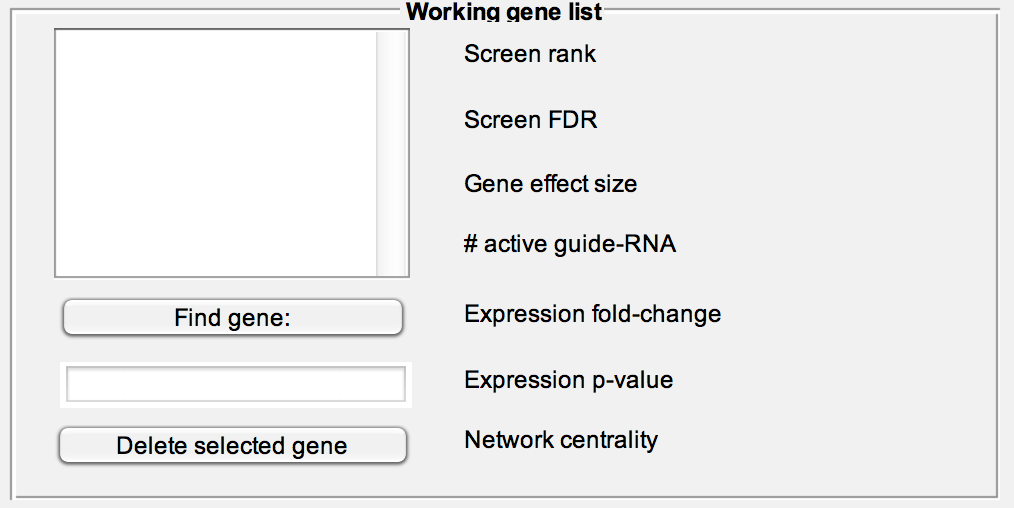
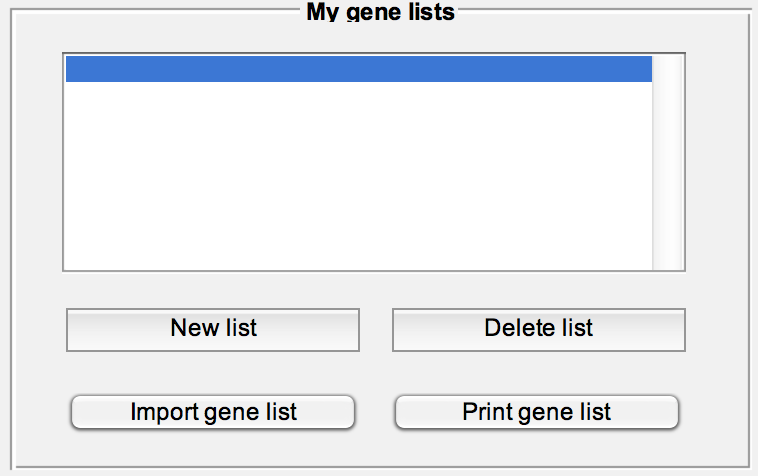
Print or delete a list, read a list from file (text file with one gene symbol per line) or create a new list populated from the "Working gene list" textbox.
##Identify screen-hit genes To compute a gene ranking, gene effect size estimate, the number of guide-RNA sequenced per gene and the number of guide-RNA which are enriched in the test population, press the "Compute screen hits" button. The default is to normalize test to control by sequencing depth. If you have explicit control sequences that you would like to use for normalization you can select that here. You will be prompted for the control sequence read counts, which you can input as a text file of the same format as the screen readout data previously loaded.
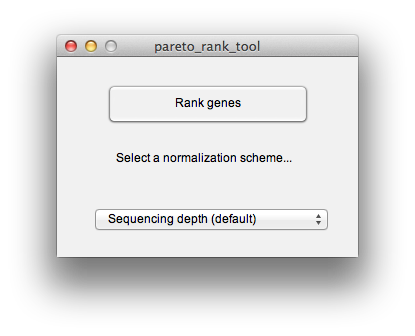
When the routine finishes, it will prompt you for a location to print out the results to a tab-separated-values file. Now might also be a good time to save your session. The output file should look like this:
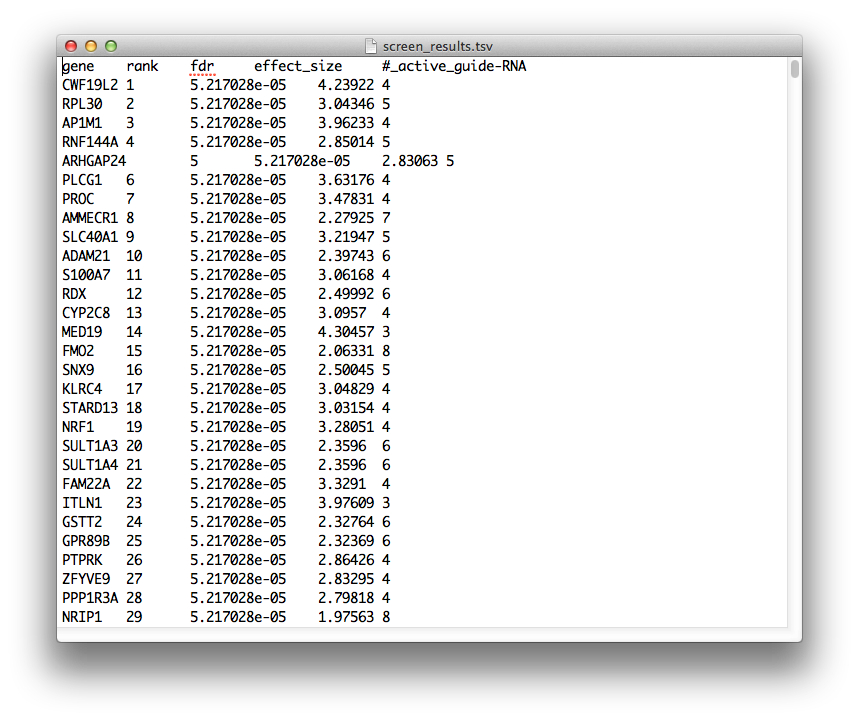
The fields have the following meaning:
-
gene: gene symbol -
rank: rank within the screen, genes with higher rank are more likely to mediate the phenotype of the test population. Higher ranked genes should be prioritized for downstream validation and analysis. -
fdr: positive false discovery rate (q-value), estimated by library swap. -
effect_size: the central tendency of the distribution of guide-RNA, log-odds ratios targeting the given gene. The larger this number, the greater the observed effect of the gene's knockdown/knockout in producing the phenotype of the test population. -
#_active_guide-RNA: the number of guide-RNA, which have a read-count odds-ratio > 1, targeting the given gene. The larger this number, the more reproducible the effect of knockdown/knockout in producing the phenotype in the test population.
##Visualize screen readout To visualize the results of the screen, after performing a gene ranking, click on the "Plot screen readout" button. This will raise the multi-objective plot module. HiTSelect's philosophy is that given two genes with the same effect-size on phenotype, the gene whose effect is more reproducible should be prioritized for down-stream validation and study. HiTSelect's multi-objective plot enables identifying these reproducible hits.
The multi-objective plot displays the effect-size and reproducibility of each gene. Genes are colored by rank in the screen and higher ranked genes are more red. The plot comes with a full suite of plot tools to pan, zoom, save and print the plot window.
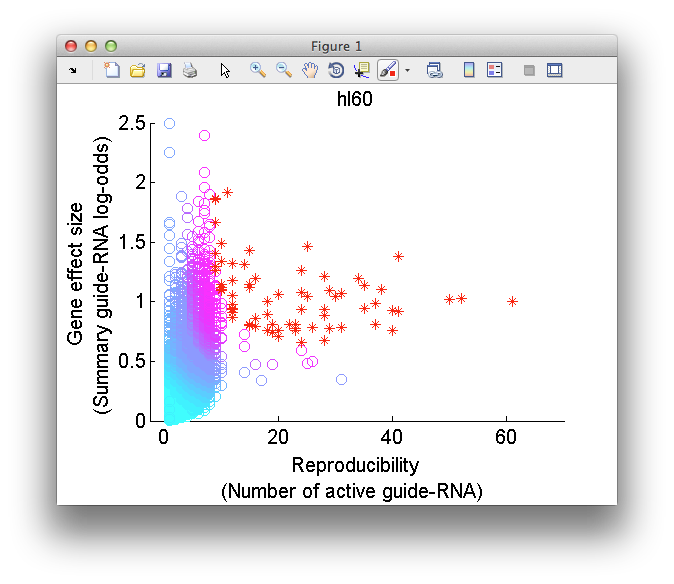
As you mouse over a gene in the scatter plot, meta-data for the gene will be displayed in the "Screen readout" window, including gene expression data if it is loaded and network-centrality data if you have ran the "Compute gene interactions" module. Like all HiTSelect modules, the visualization module lets you curate gene lists and export them to the main desktop for analysis using other modules.
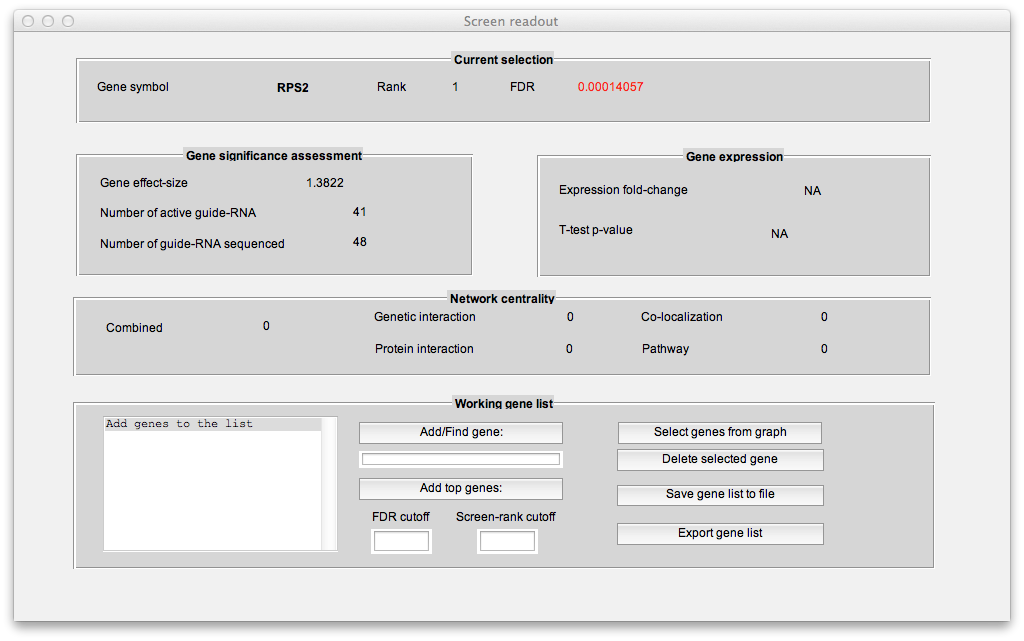
In the "Working gene list" window, you can search for genes in the screen. You can also add multiple genes at once to the working list using thresholds on gene rank and FDR. Another way to add genes to the working list is by clicking the "Select genes from graph" button which will let you add genes by clicking on the multi-objective plot. One approach is to drag-click (after first pressing the "Select genes from graph" button). This will let you add genes by thresholding gene effect-size and reproducibility:
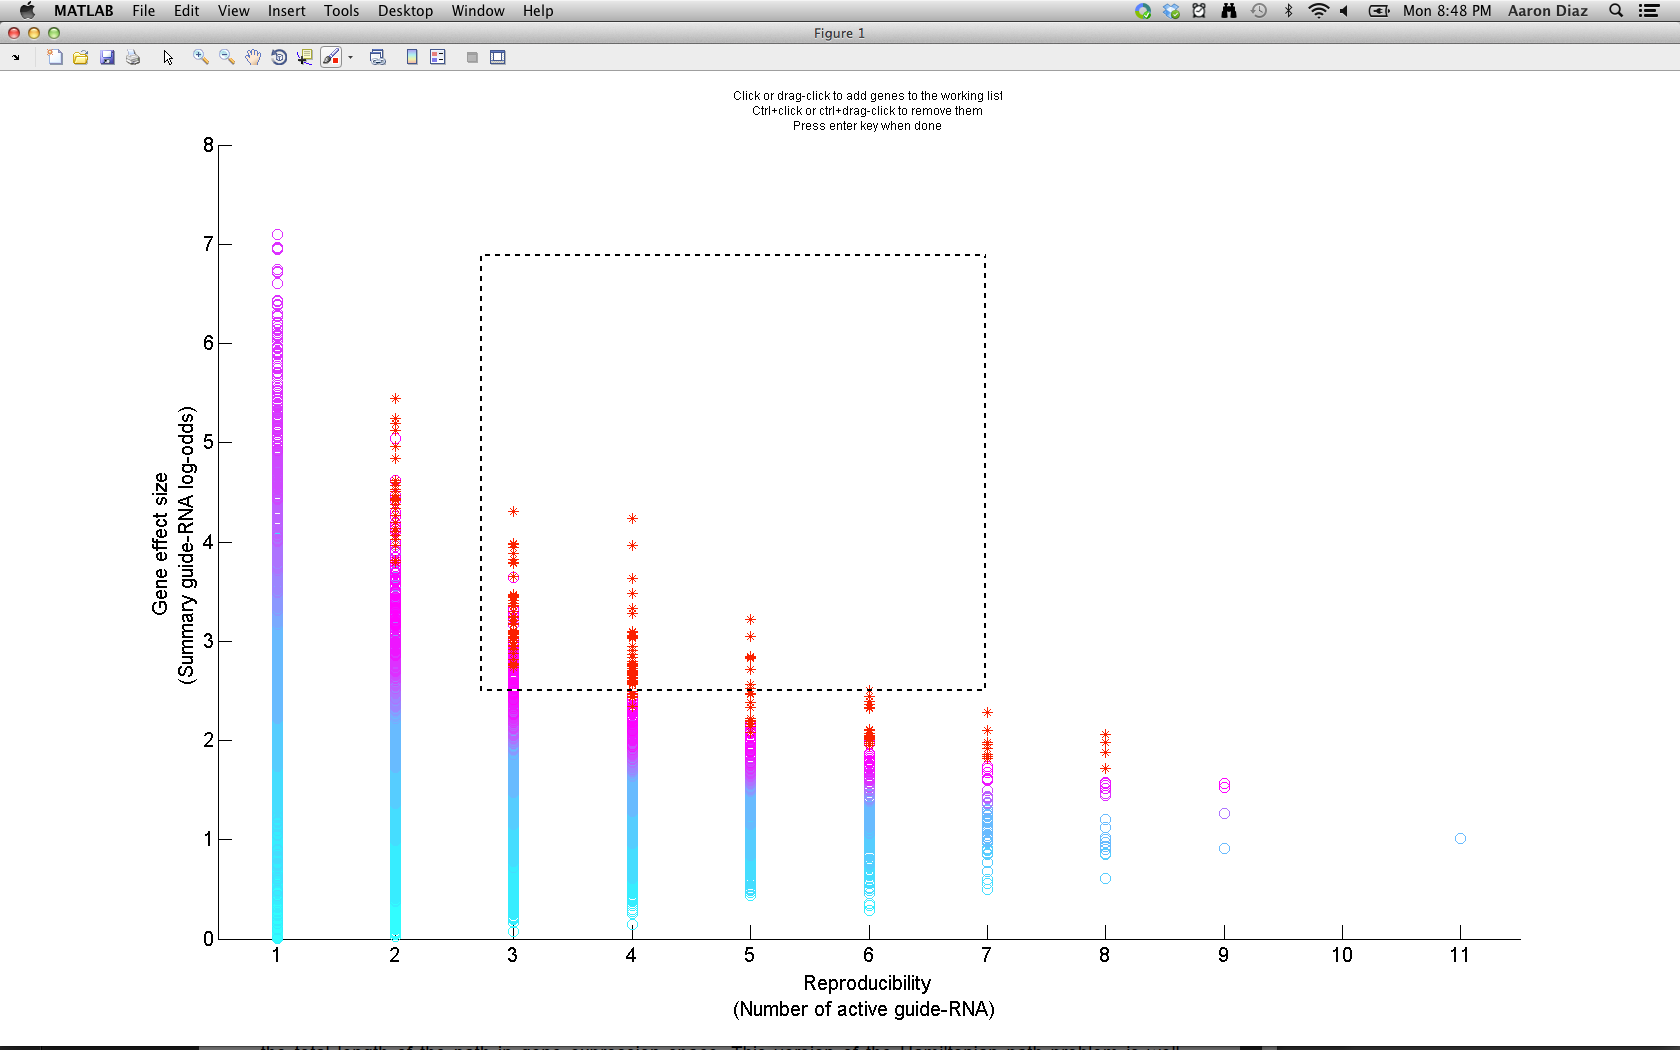
Once you have a list of interesting genes (the top 1% ranked genes is a good starting point), you can export them to the main desktop by clicking "Export gene list".
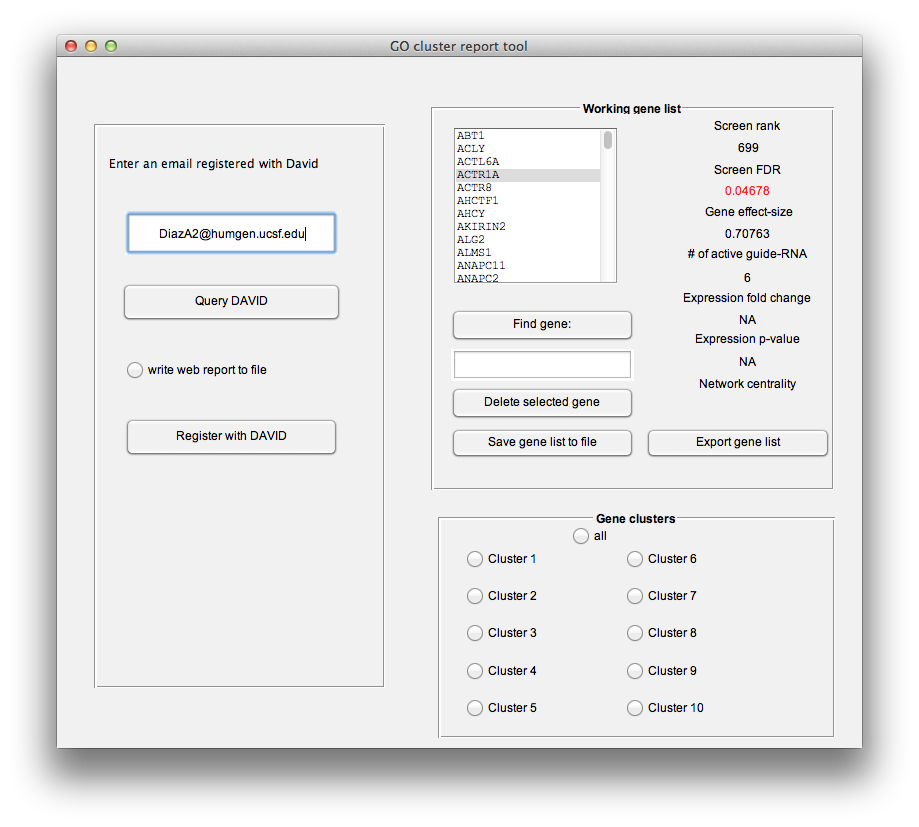
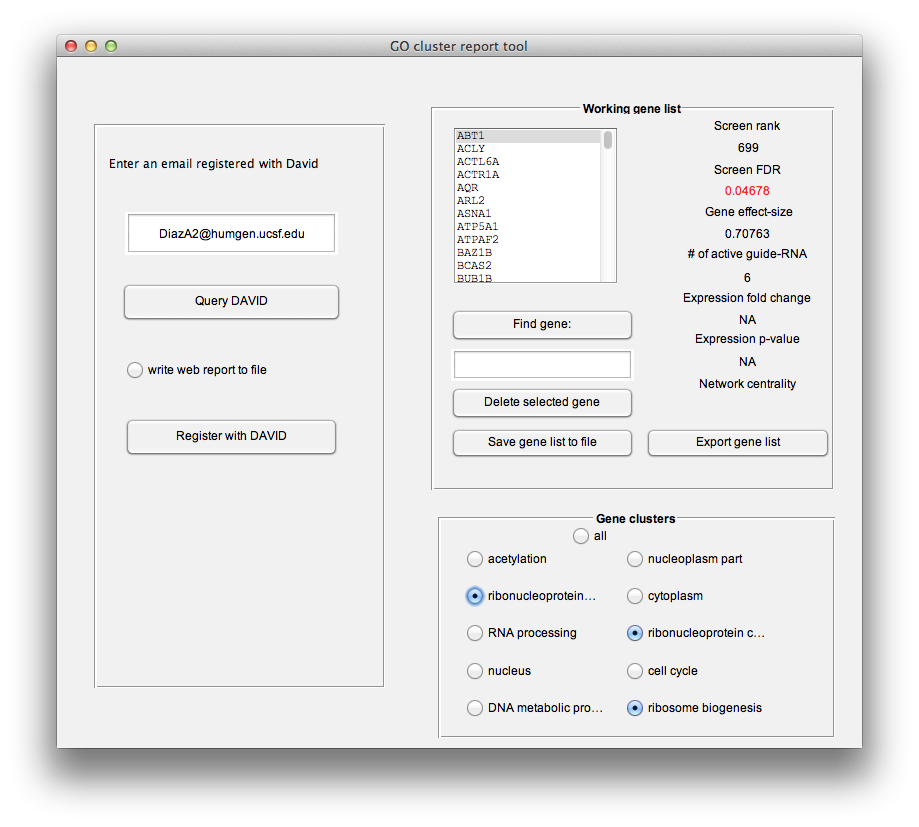
##Hierarchical cluster screen-hit gene ontology To annotate a gene list with gene ontology and other functional annotation terms, to perform hierarchical clustering of genes by functional annotation terms, to identify and visualize functional gene modules, click the "Analyze gene ontology" button. This will raise the "GO cluster report tool".
This tool will interface programmatically with DAVID to obtain a hierarchical clustering of you gene list, it will produce an interactive tree-map visualization of your clustering and it will write the annotation terms and p-values to a tab-separated-values file. If you have never used the DAVID web service then you need to register. You can click the "Register with DAVID" button to spawn a web-browser pointed to the registration page (http://david.abcc.ncifcrf.gov/webservice/register.htm). Once you have registered an email, enter it in the textbox and click "Query DAVID". If you want to save a copy of your analysis to file, be sure to check the "write web report to file" radio-button.
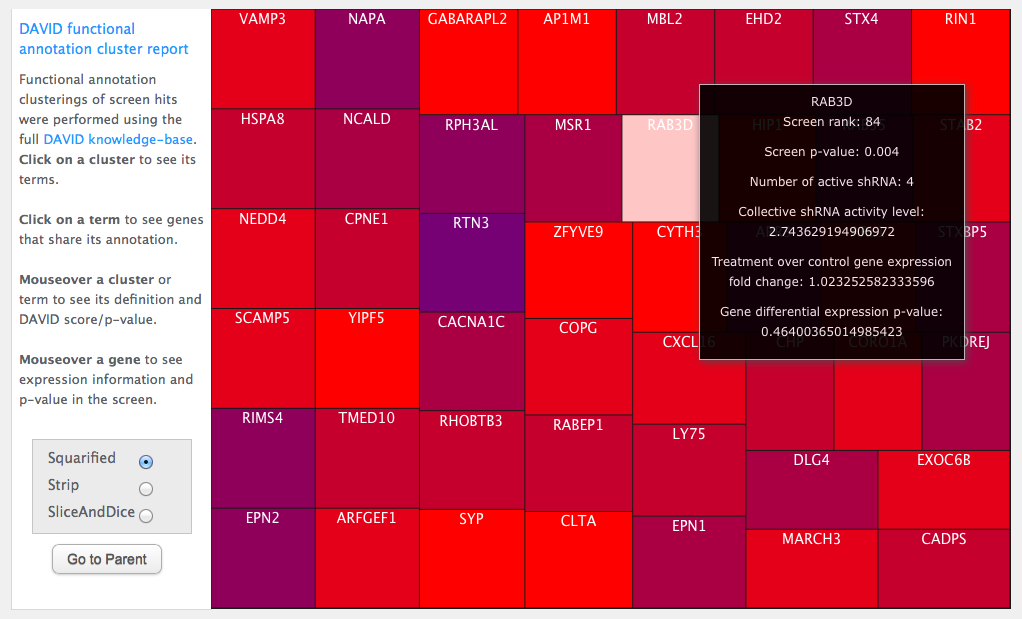
Once DAVID has responded to the query, HiTSelect will generate an interactive treemap visualization and spawn a web-browser to view it. An online example can be found here: http://song.igb.illinois.edu/ipsScreen/docs/david_treemap.html. It will look like this:
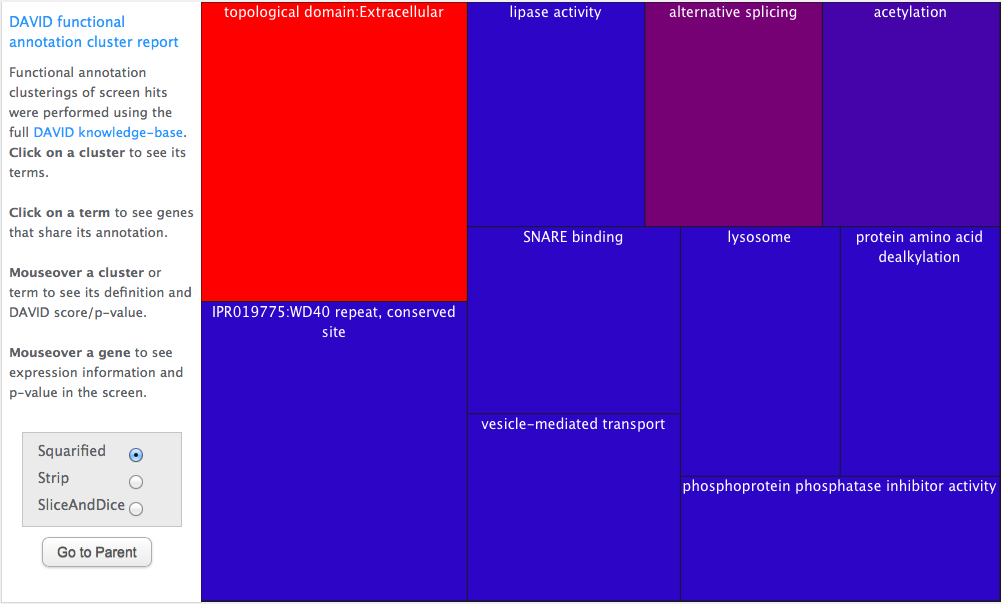
Genes have been annotated with functional annotions from the DAVID database ensemble. Genes have then been clustered by annotation term into functional modules, and the top map describes this clustering. The bigger the box, the more genes are in the cluster. The more red the box, the more statistically significant the cluster. (See http://david.abcc.ncifcrf.gov/content.jsp?file=functional_annotation.html for a description of how the clustering is performed and p-values calculated.)
Clusters are labeled by the most over-represented gene ontology term for genes in that cluster. Mouse over a cluster to raise a data-tip explaining that term and showing the p-value:
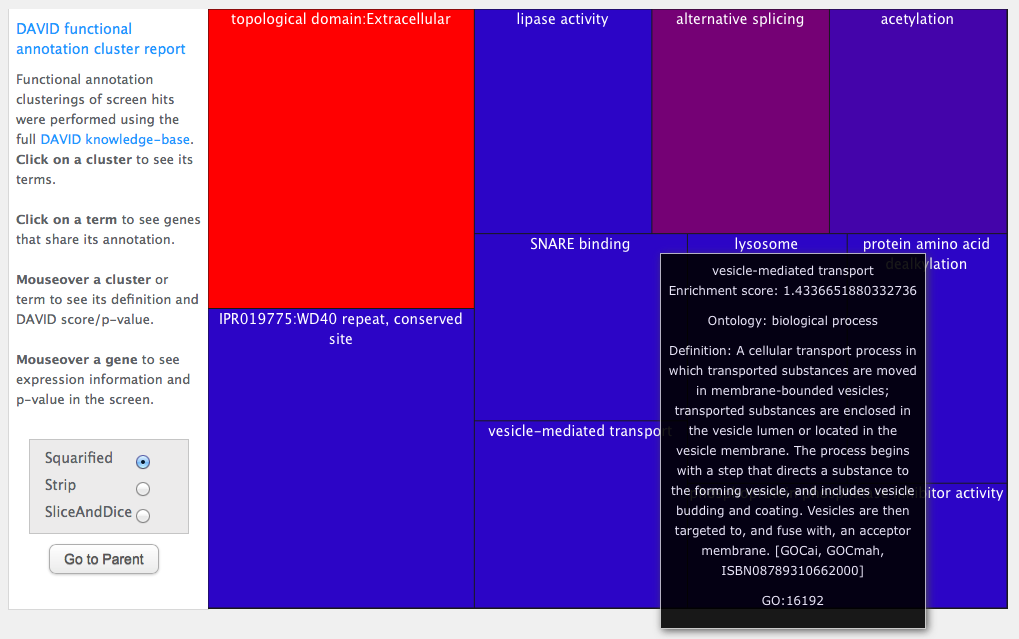
Click on a cluster and you raise a treemap describing the gene ontology terms for genes in the cluster. The bigger the box, the more genes with that term. The more red the box, the more statisticaly significant the association is. Mouse-over to see p-values and annotation term definitions:
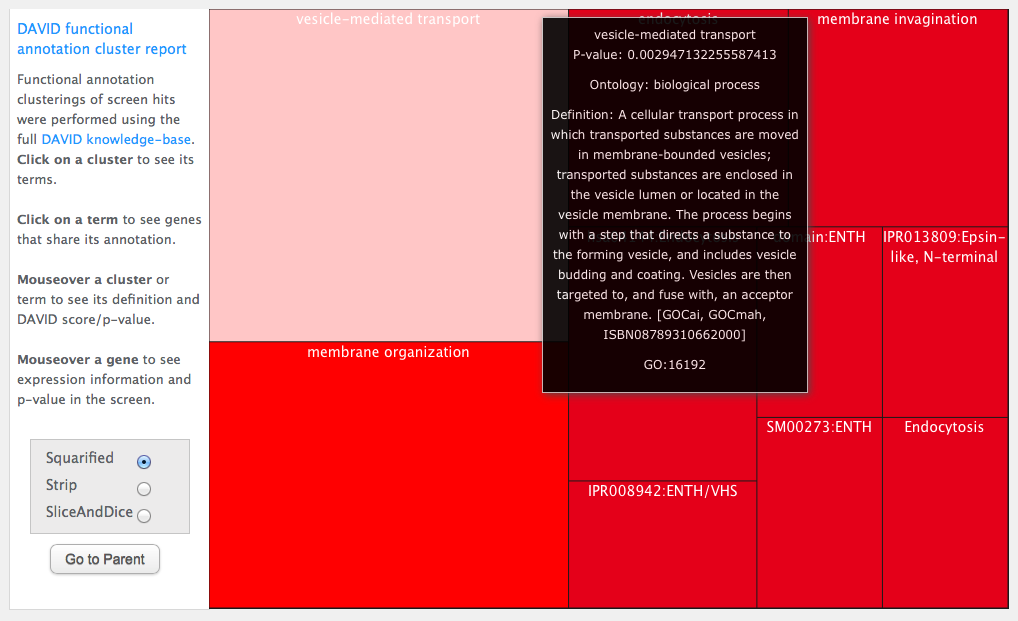
Click on an ontology term and it will raise a treemap of gene symbols. These are the genes in the original cluster which share the ontology term you clicked on. Mouse over a gene to see its meta-data in the screen:
You can curate your working gene list by adding or removing genes belonging to specific clusters using the radio buttons in the bottom right of the "GO cluster report tool" window. One strategy is to select a sub-set of genes from interesting clusters and then re-run the "Query DAVID" command to "sub-cluster" the smaller list. Also, you can export the working gene list back to the main desktop using the "Export gene list" command which will create a new gene list in the main desktop which you can then pass to other modules or save for later.
##Screen-hit interaction network
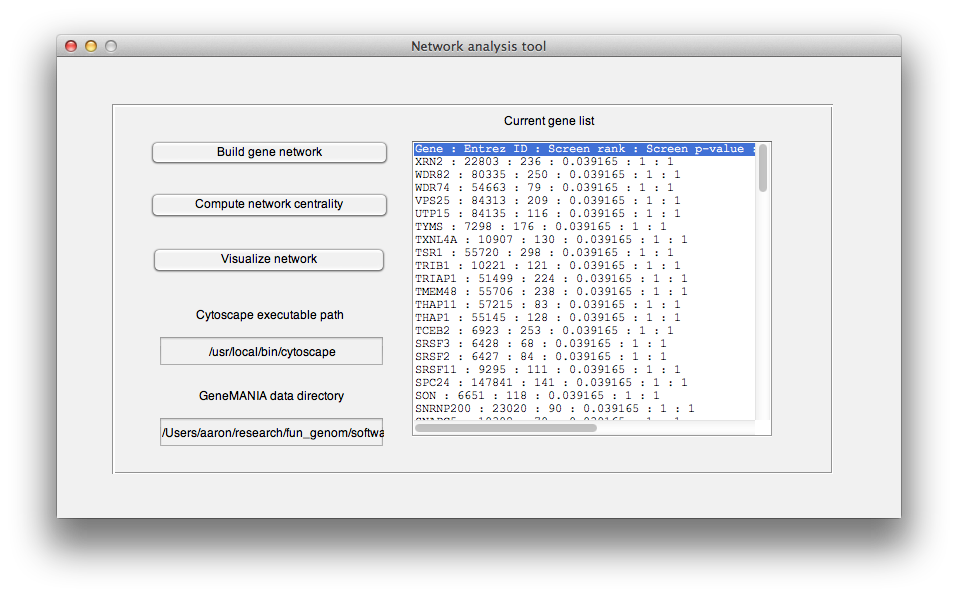
To generate an interaction network for a given gene list, click on the "Compute gene interactions". This raises the "Network analysis tool".
-
Begin by entering the full path of the unziped genemania database directory, that you obtained during installation. See installation for obtaining this database. Then press "Build gene network" button. This will launch a query to a local copy of Genemania's database, bundled with HiTSelect, which will search for interactions between your genes. HiTSelect looks for the following types of interactions: genetic (knock one gene down and another changes in expression), pathway (genes are part of the same gene ontology pathway), physical (gene protein products interact physically) and co-localization (the genes are expressed specifically in the same tissue). See genemania.org for more explanation about Genemania networks.
 Once this is done, HiTSelect will prompt you for a location to wite the following files:
-
genemania_query: This is a "query file", a type of manifest used by the command line version of Genemania, which HiTSelect used to submit your query. -
genemania_query-results.report.txt: This is the output of Genemania, HiTSelect parses this file to generate meta-data for Cytoscape visualization. You might want to use it for your own analysis. -
network_flatfile.sif: This is a textfile representation of your interaction network that can be parsed by several network analysis tools, such as Cytoscape. -
pareto_tool_vismap.props: This is a "Vismap" file, a type of network style file used by Cytoscape. It will automatically set up color and size preferences for visualizing your network. -
screen_pval.attrs: This is a Cytoscape attributes file, you can use it to annotate your genes with screen p-value information in Cytoscape. -
screen_rank.attrs: This is a Cytoscape attributes file, you can use it to annotate your genes with screen rank information in Cytoscape.
-
-
The next step is to compute joint-network centrality. It is recommended that you only perform this once with the largest list you plan to work with (for example all genes with FDR<0.01). It annotates genes with their eigenvalue network centralities with regards to each of the 4 networks HiTSelect analyses. Then it annotates your genes with their joint-network centrality, a summary statistic of centrality across all networks. It also writes the following files:
-
Co-localization_network_centrality.attrs: This is a Cytoscape attributes file, you can use it to annotate your genes with gene co-localization network centrality in Cytoscape. -
combined_network_centrality.attrs: This is a Cytoscape attributes file, you can use it to annotate your genes with joint-network centrality information in Cytoscape. -
Genetic_network_centrality.attrs: This is a Cytoscape attributes file, you can use it to annotate your genes with physical network centrality information in Cytoscape. -
Pathway_network_centrality.attrs: This is a Cytoscape attributes file, you can use it to annotate your genes with pathway network centrality in Cytoscape. -
Physical_network_centrality.attrs: This is a Cytoscape attributes file, you can use it to annotate your genes with physical network centrality in Cytoscape.
-
-
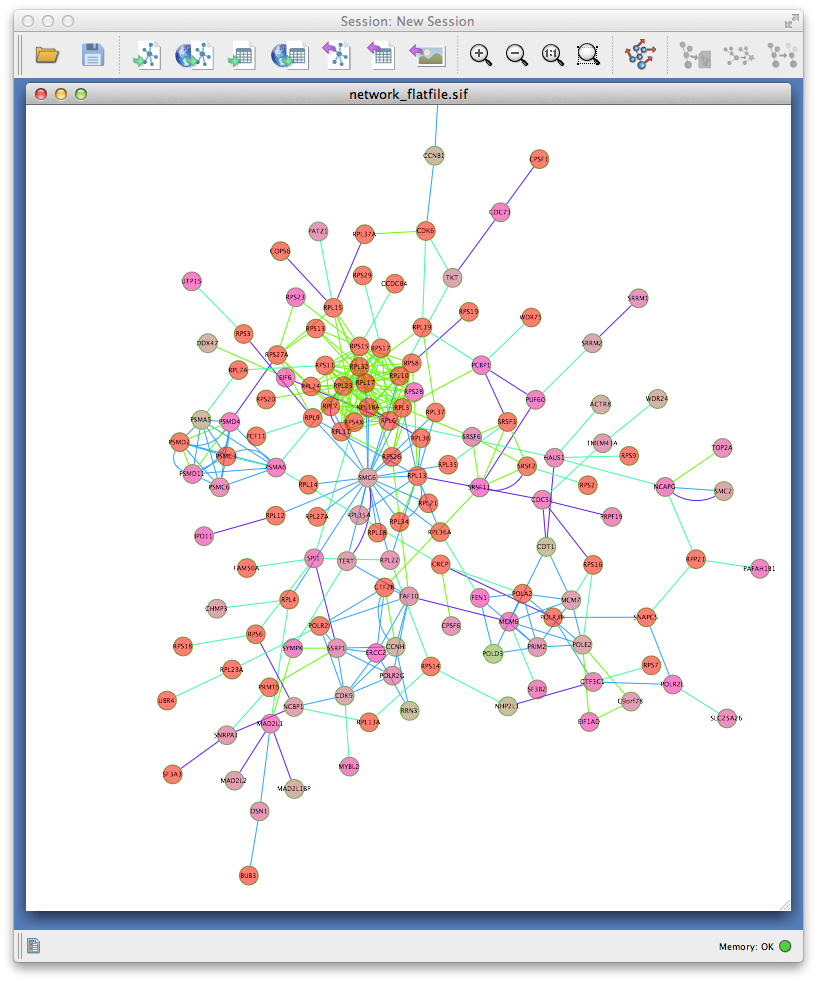
Lastly, if you have Cytoscape installed then enter the full path in the textbox and click the "Visualize network" button. This will spawn a copy of Cytoscape and load your gene interaction network for visualization. You can load the attributes and vismap files from there to enhance you network analysis:
