A tool that enables you to programmatically (or not, web interface is in the plan) interact with your downloaded Facebook data
- Fully deserialized
Messagemodel grouped based onFriendmodel.- Handles the following message formats:
TextMessagemodelStickermodelPhotosmodel
- Timestamp in milliseconds and UTC
datetimeobject - NEW conversion to
pandas.DataFrameobject
- Handles the following message formats:
FriendMetricmodel that offers quantitative metrics of aFriendmodel
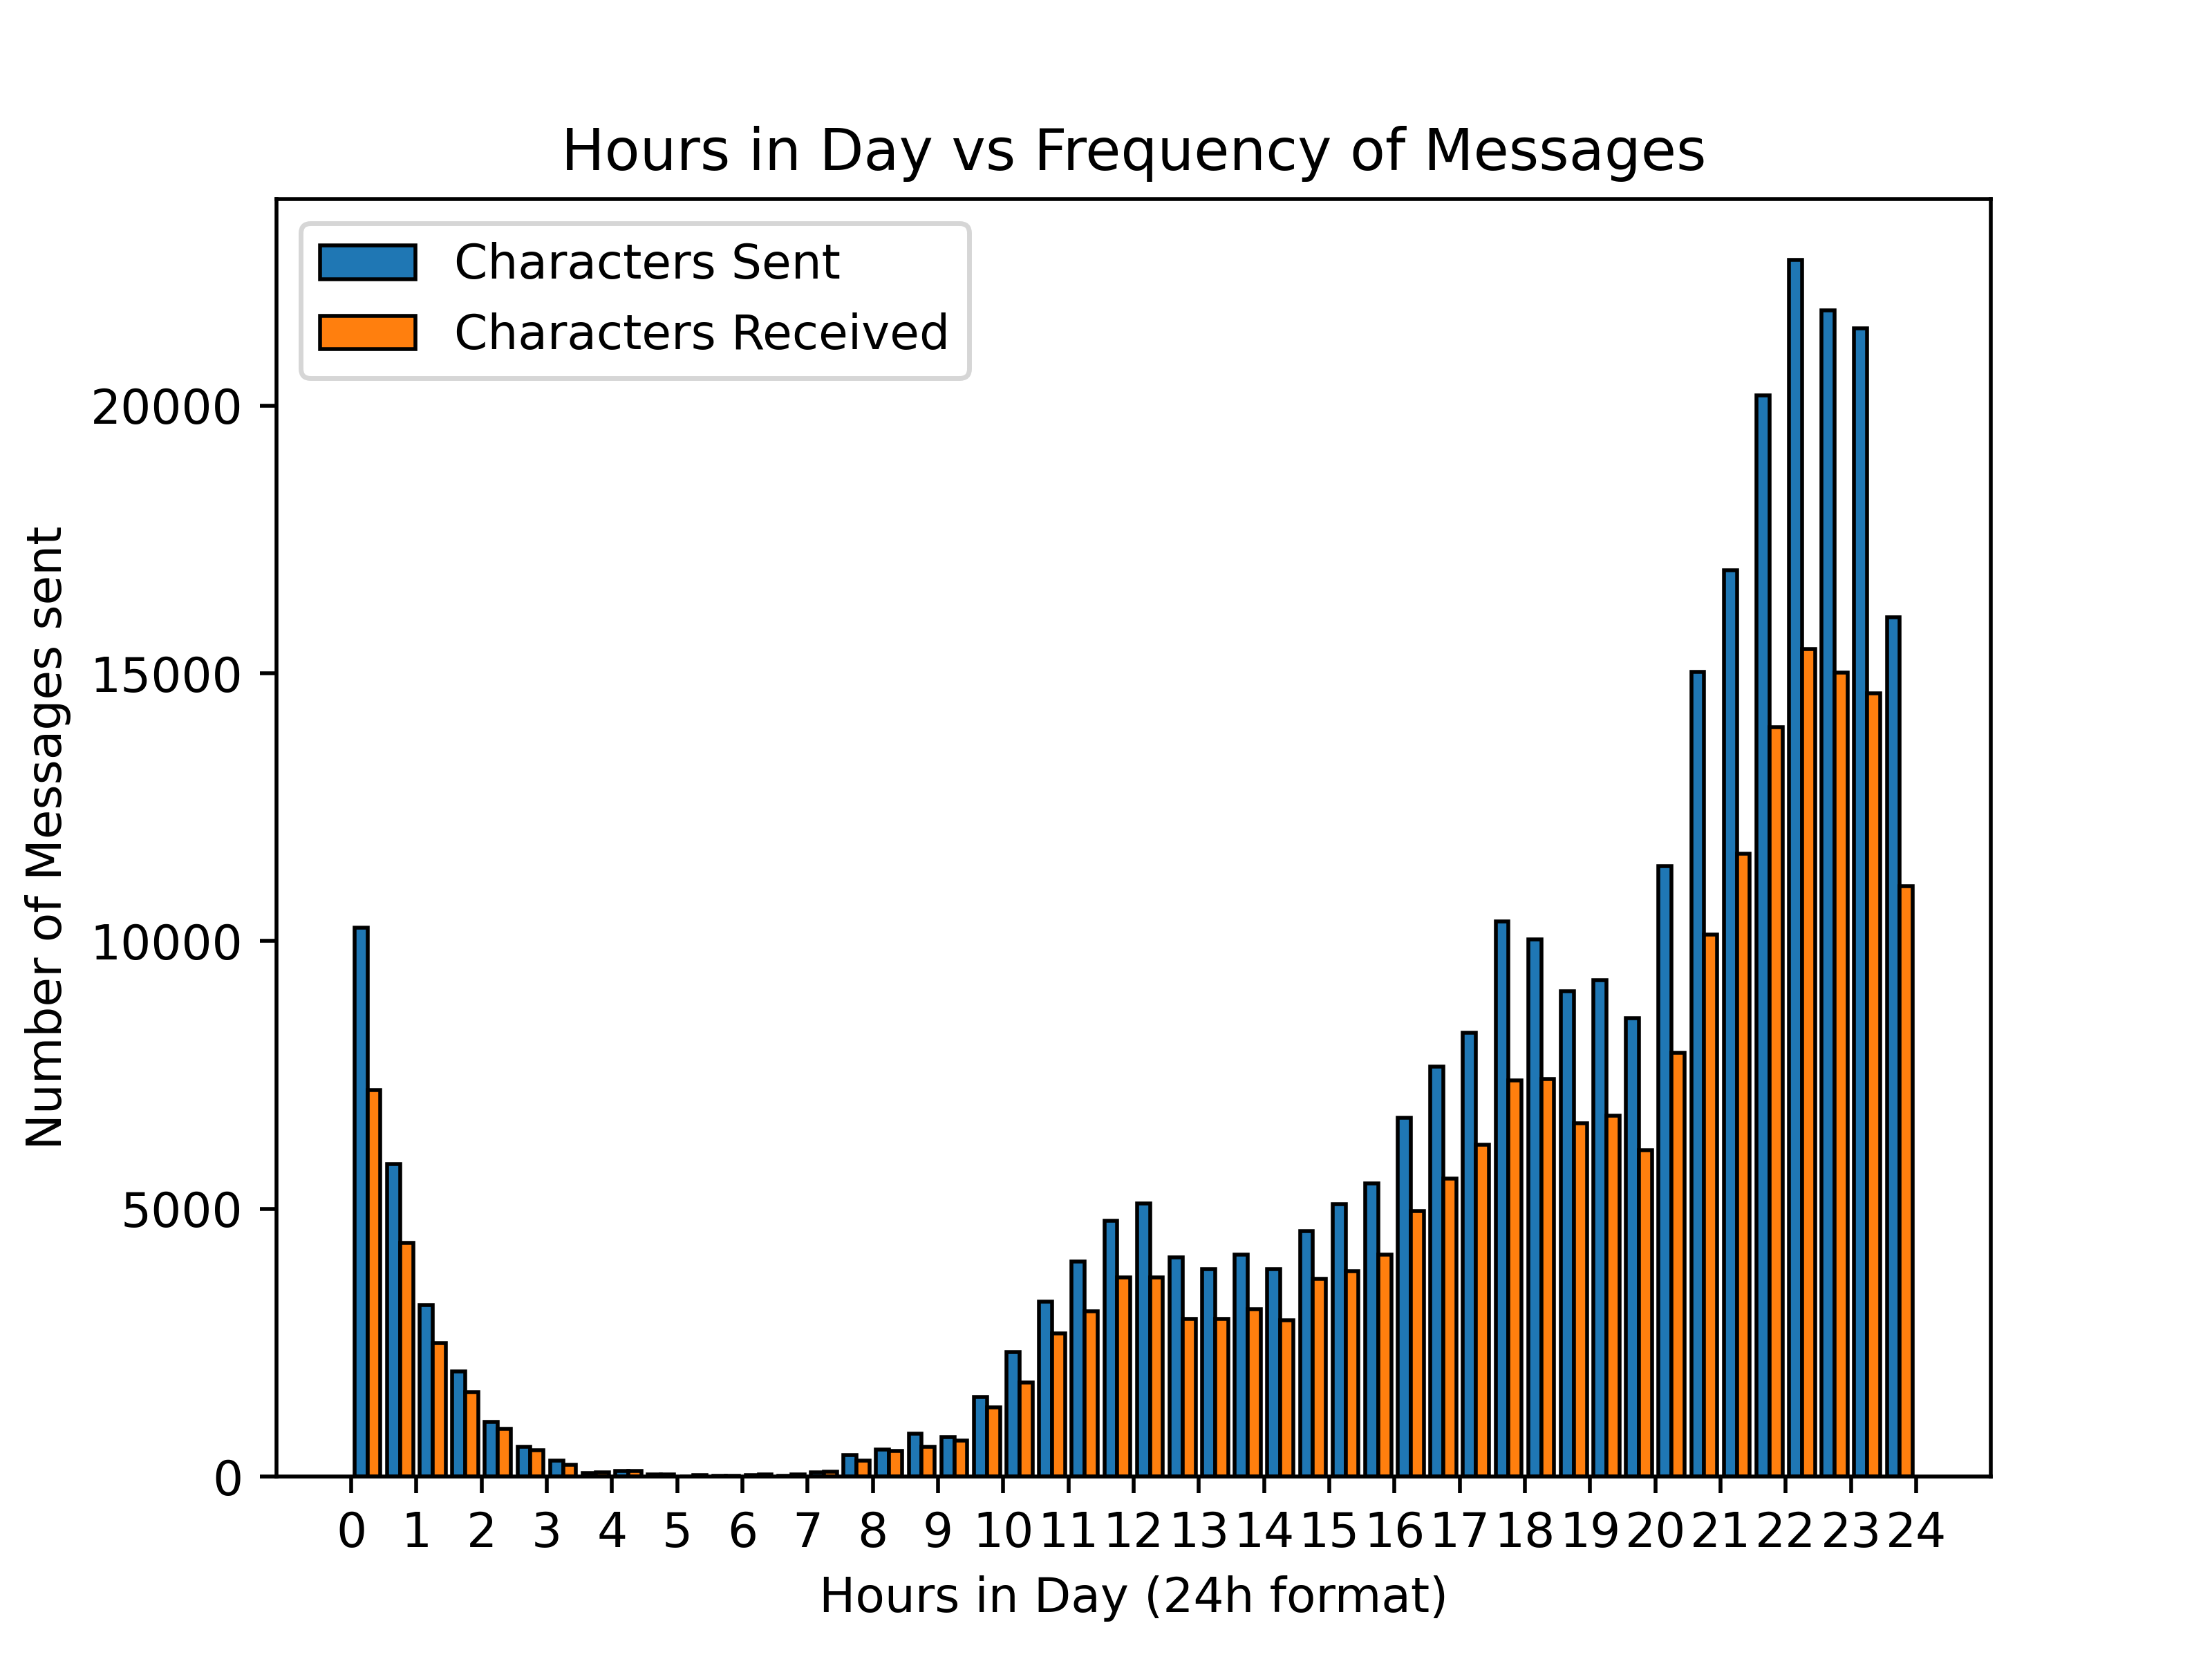
Directly, from the graph you can tell:
- I message people more than they message me (in terms of characters count)
- I tend to initiate conversations more
- People usually respond within 30 minutes (every bar is 30 minutes)
# ---------------------------[ FBDataAnalyzer Code ]------------------------------
from FBAnalyzer import FBAnalyzer
fb_analyzer = FBAnalyzer(root_path="{PATH_TO_FB_DATA}")
msg_freq = fb_analyzer.get_msg_freq_minutes_since_midnight(msg_sent=True)
receive_msg_freq = fb_analyzer.get_msg_freq_minutes_since_midnight(msg_sent=False)
# ---------------------------------------------------------------------------------

import matplotlib.pyplot as plt

minute, frequency = zip(*msg_freq)
minute_rec, frequency_rec = zip(*receive_msg_freq)

plt.hist(
    [minute, minute_rec],
    weights=[frequency,frequency_rec],
    bins=1440//30,
    label=["Characters Sent", "Characters Received"],
    edgecolor='black',
    linewidth=0.8
)

plt.xticks(ticks=minute[::60], labels=range(25))
plt.title("Hours in Day vs Frequency of Messages")
plt.xlabel("Hours in Day (24h format)")
plt.ylabel("Number of Messages sent")
plt.legend(loc="upper left")
plt.savefig('../docs/images/msg_freq_histogram.png', dpi=500)