a clever bot to rate and improve your ggplot plot
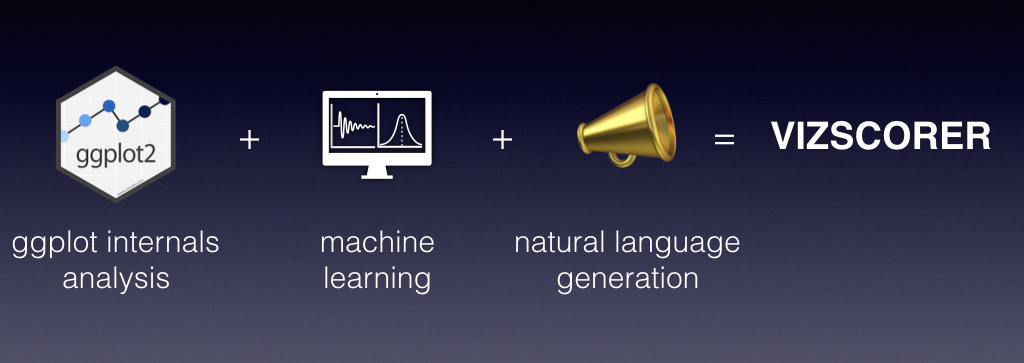
Vizscorer is an R package which tries to help users discover weaknesses in their ggplot plots. To do so it applies a mix of machine learning and natural language generation.
Vizscorer basically:
- looks at ggplot internals
- analyzes them
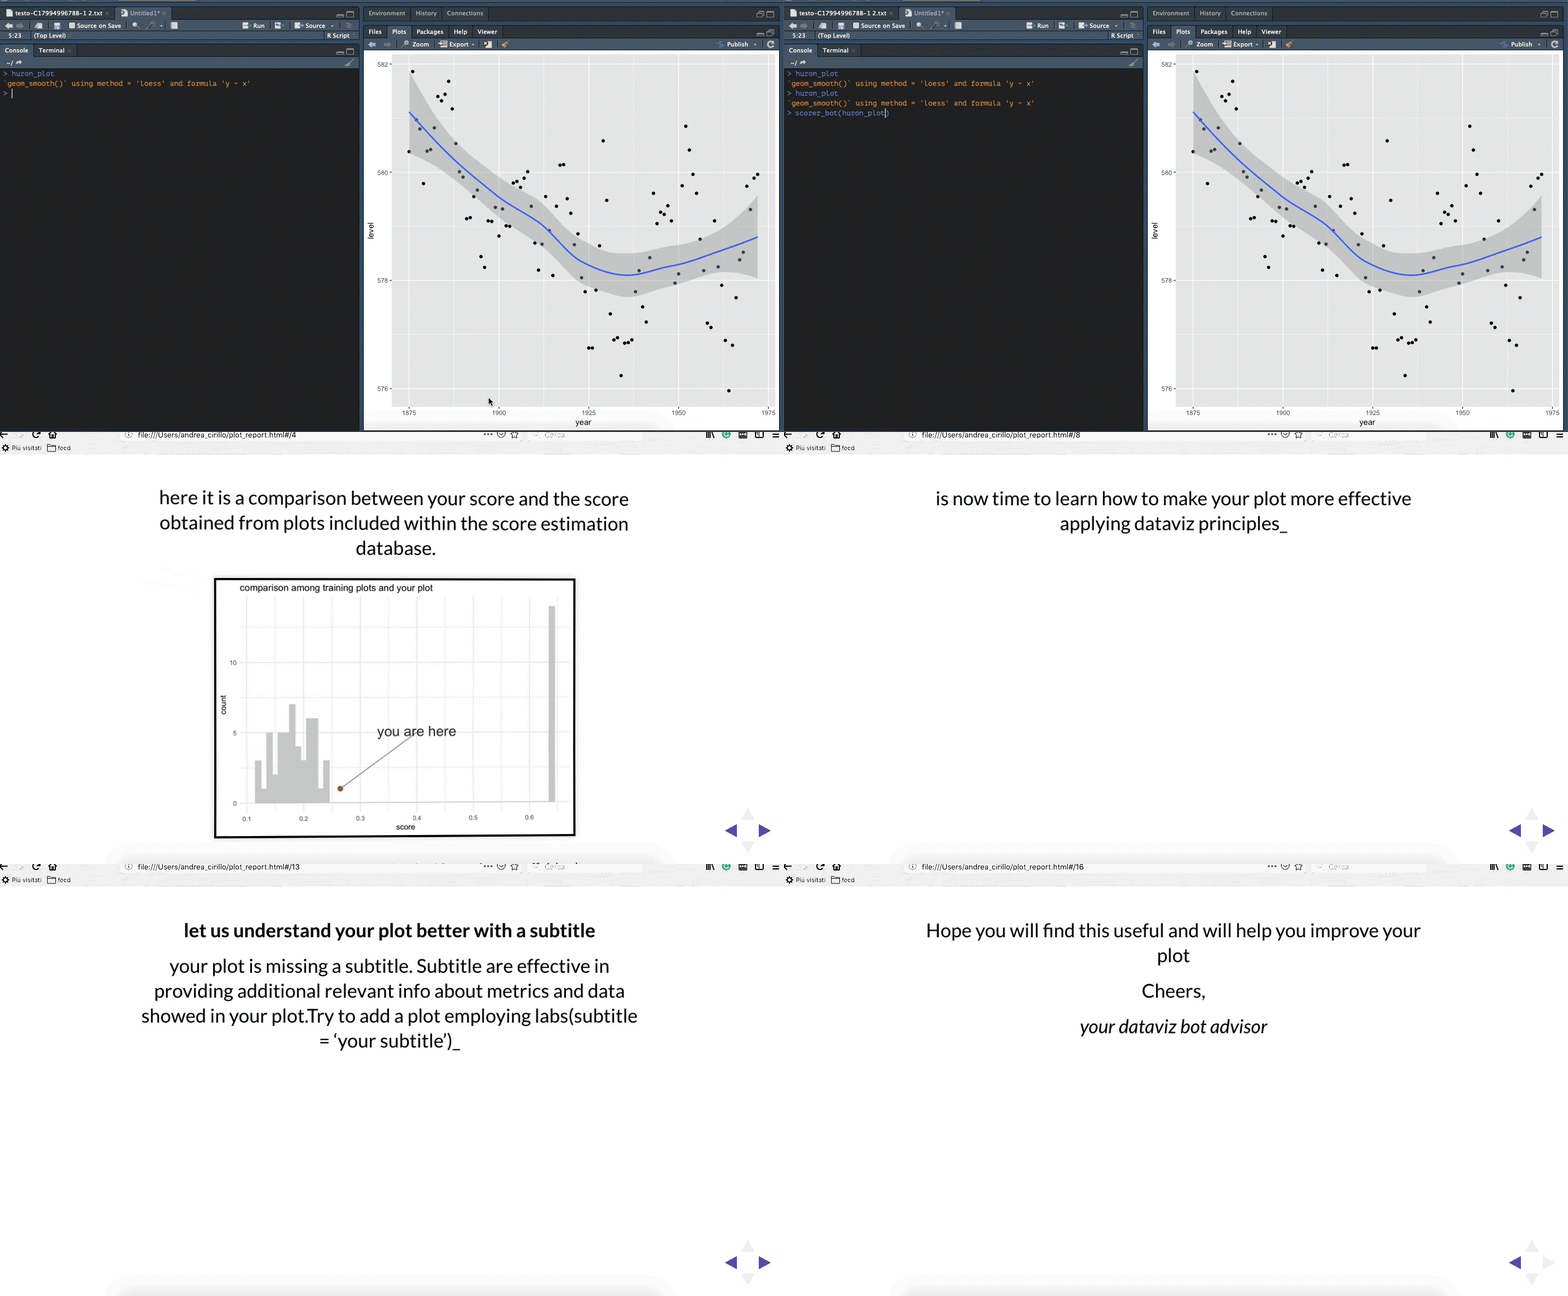
- produces a deck of slides showing an overall evaluation and detailed suggestions about how to improve the plot.
See it in action below:
Vizscorer continues the effort started with paletteR to increase the level of quality of the average plot produced in companies, where there is no time to study data visualization theory.
install vizscorer package:
devtools::install_github("AndreaCirilloAC/vizscorer")
call the scorer_bot on your ggplot plot:
scorer_bot(plot_object = your_ggplot_plot)
after some strange code populating your console a web browser will show up to display you a deck of slide containing:
- an assessment of your plot
- a set of customized suggestions about how to improve your plot, based on data visualization principles
vizscorer is currently in beta mode and every feedback and support from early adopters is more than welcome :)
The package currently does not support complex ggplot plots, like plots with data not provided within the ggplot() call but rather within the other layers. If any issue arises, please consider submit an issue within the Issues section or forking the repo and fix it by yourself!
- increasing the number of plots employed for training the gradient boosting model (more about this in a forthcoming blog post)
- introducing a “console version” of the report, more usable and less annoying in the long run
- increasing the level of cleaverness of the bot to make it able to analyse more complex plots and provide even more useful suggestions

