-
Notifications
You must be signed in to change notification settings - Fork 196
Working with geospatial data
Working With Geospatial Data topics:
- Handling Geospatial Data in Excel Files
- Handling Geospatial Data in WGS84
- Handling Geospatial Data in Other Geocoordinate Systems
- Publishing Geospatial Data
- KML Customization
Tutorial Data:
- geo_2007.owl
- point_mixed_srid.csv
- point_no_srid.csv
- point_no_srid_one_coordinate_system.csv
- Well_Data.xls
- Line.csv
- Polygon.csv
This section describes how to import Excel files and obtain your desired geospatial data precision.
Before importing an Excel file to IDS, your cell format needs to be set at the desired decimal place. For example, if the decimal places for the columns Latitude and Longitude are set to 6, the imported worksheet in IDS shows 6 decimal places like the figures below.
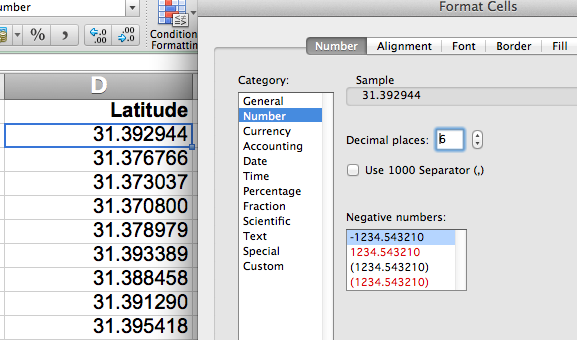
 On the other hand, if the decimal place is set to 2 for the column Latitude and is set to 6 for the column Longitude, the imported worksheet in IDS shows 2 decimal places for Latitude and 6 decimal places for Latitude like the figures below.

This section describes how to model geospatial data in WGS84 geocoordinate system.
Example 1. Model WGS84 points
-
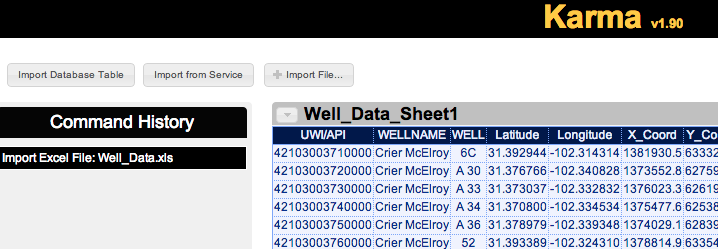
Import “Well_Data.xls” and then import “geo_2007.owl”

-
Select “OWL Ontology” to confirm the file format

-
Successfully import the ontology (“geo_2007.owl”)

-
Click on the top-left corner of the target worksheet and then click on “Show Model”


-
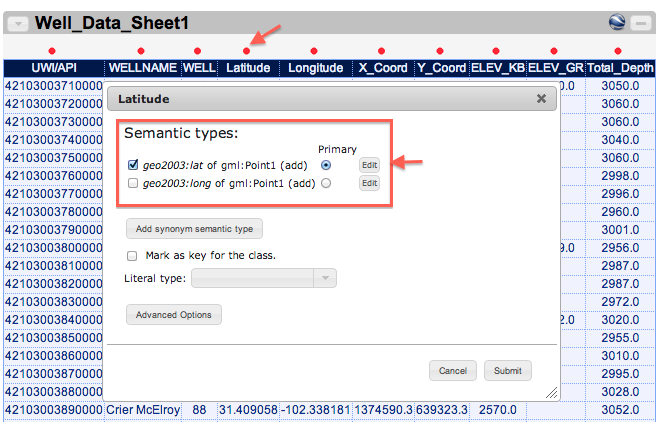
Click on the red dot on top of the latitude column to start modeling your data
-
Click on “Edit” to select a semantic type for the latitude column
-
Note that the red box below shows your modeling history. If you have never modeled this data before, your IDS will not show any history.
-
Click “Browse”

-
Select “geo2003:lat” and click “Submit”
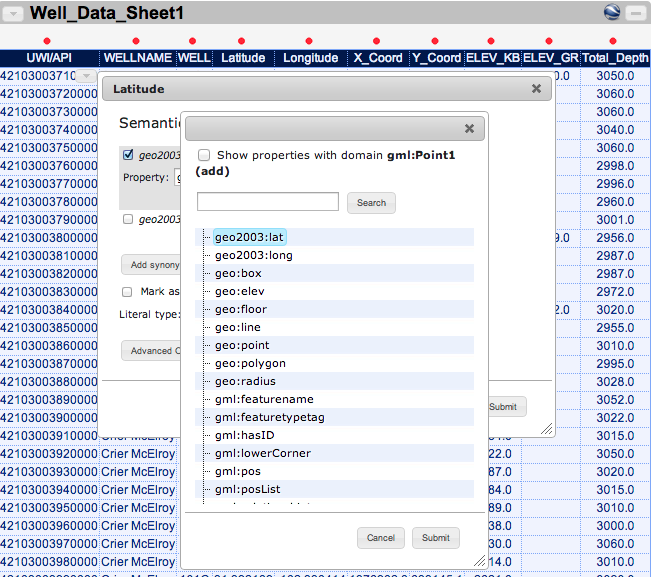
-
Click “Browse”
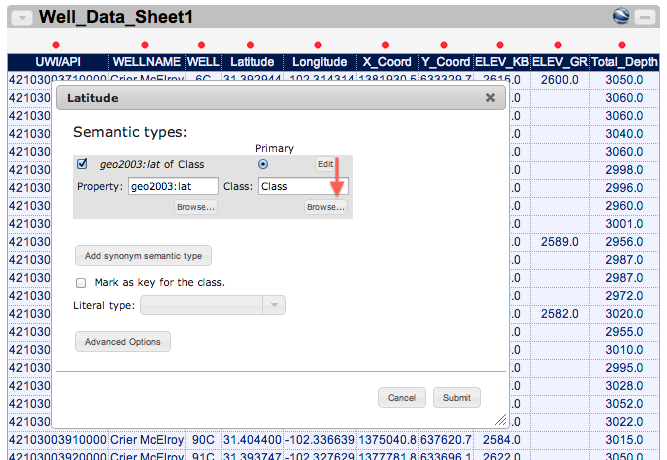
-
Select “gml:Point” and click “Submit” [[images/geoimage14.png|center|frame |]]
-
”Latitude” column is modeled

-
Do the same for the “Longitude” column
-
Choose “geo2003:long” and “gml:Point” (or “gml:Point#”, such as “gml:Point1”)

-
Both the “Latitude” and “Longitude” columns are modeled
-
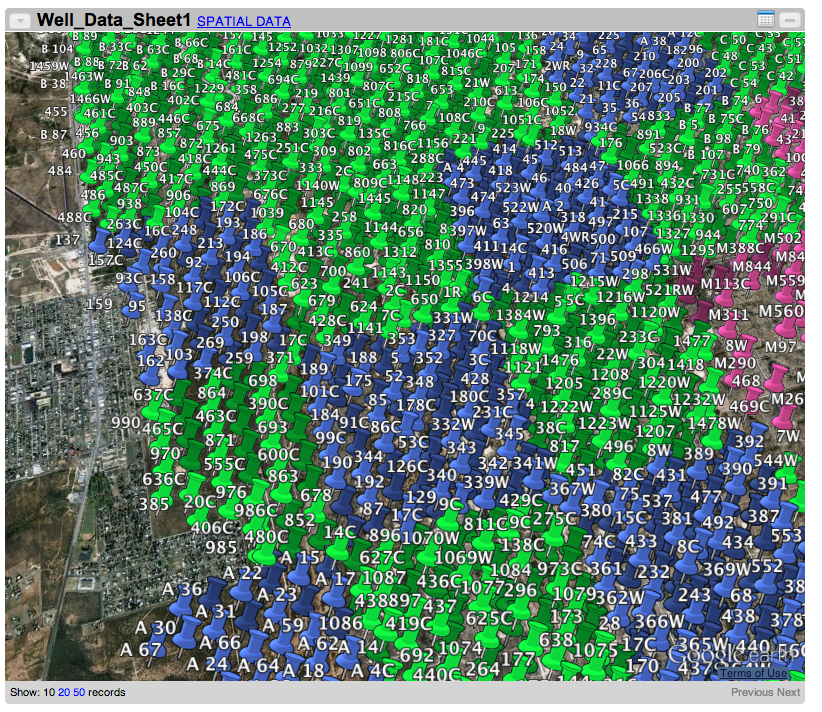
Click on the Google Earth icon to see your data in browser (optional, this function will send data to Google)
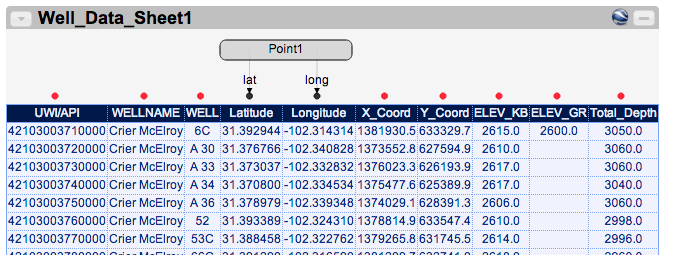

Example 2. Model the column that contains both longitude and latitude (in this order)
-
Import “Well_Data.xls” and then import “geo_2007.owl”
-
Click on the top-left corner of the target worksheet and then click on “Show Model”
-
Click on the red dot on top of the “LongLat” column to start modeling your data

-
Choose “gml:pos” and “gml:Point” (or “gml:Point#”, such as “gml:Point1”)
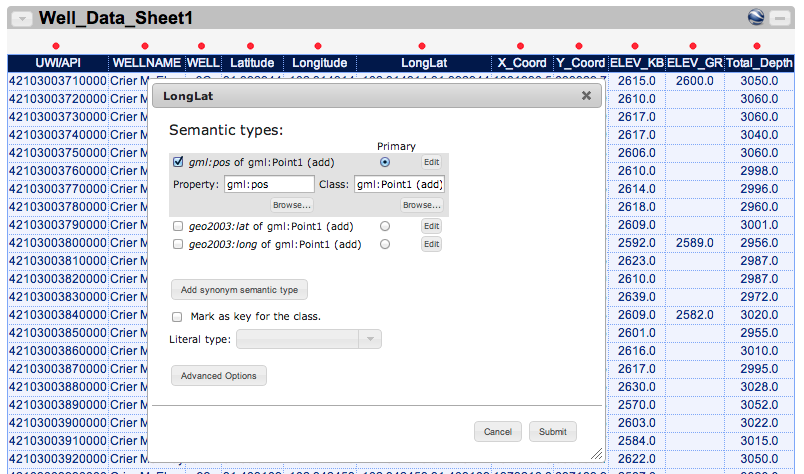
-
Click on the Google Earth icon to see your data in browser (optional, this function will send data to Google)
Example 3. Model every column with AutoModel
-
After you model your point columns, click on the top-left corner of the target worksheet and then click on “AutoModel”

-
Now every column is automatically modeled using the column names
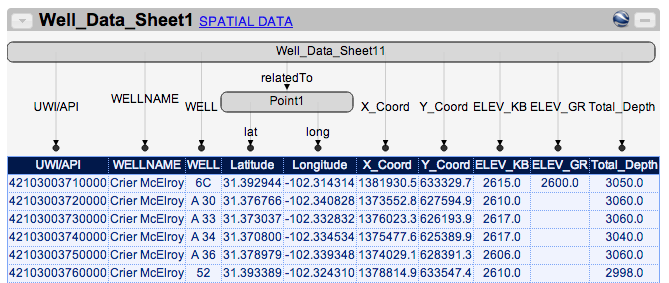
-
Click on the Google Earth icon to see your data in browser (optional, this function will send data to Google)

Example 5. Model Line Data in Well-Known Text (WKT)
-
Import “Line.csv” and then import “geo_2007.owl”
-
Click on the top-left corner of the target worksheet and then click on “Show Model”
-
Click on the red dot on top of the column “Line” to start modeling your data
-
Select “gml:posList” for the property and “gml:LineString” for the class of the semantic type
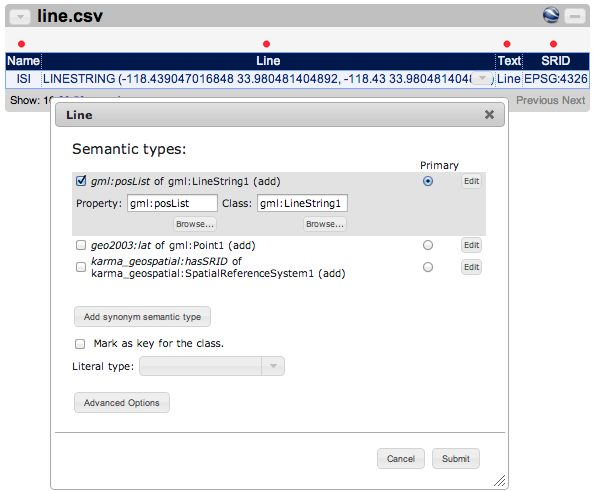

-
Click on the Google Earth icon to see your data in browser (optional, this function will send data to Google)

Example 6. Model Polygon Data in Well-Known Text (WKT)
-
Import “Polygon.csv” and then import “geo_2007.owl”
-
Click on the top-left corner of the target worksheet and then click on “Show Model”
-
Click on the red dot on top of the column “st_astext” to start modeling your data

-
Select “gml:posList” for the property and “gml:Polygon”for the class of the semantic type
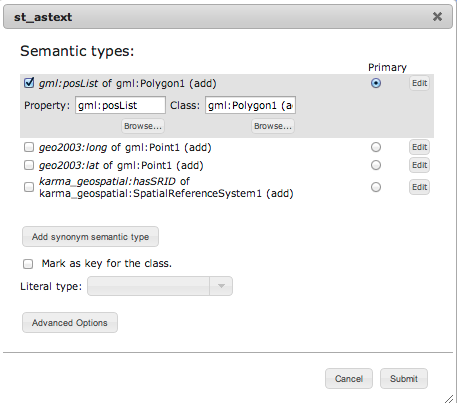
-
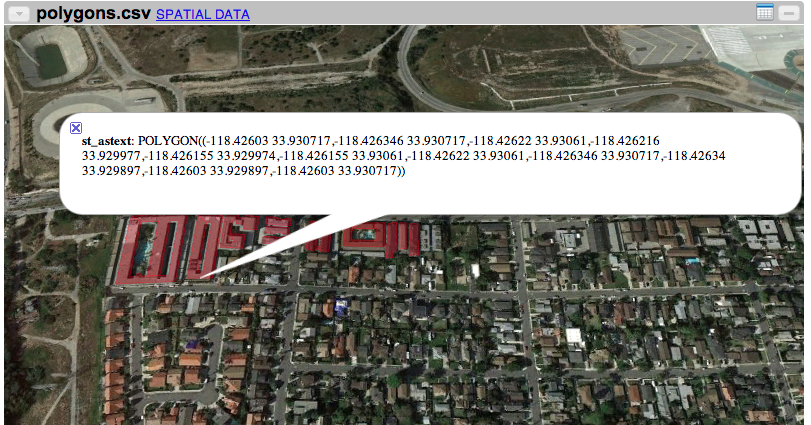
Click on the Google Earth icon to see your data in browser (optional, this function will send data to Google)
Example 1. Use the SRID column in your dataset to specify the geocoordinate system
-
Import “point_mixed_srid.csv” and then import “geo_2007.owl”
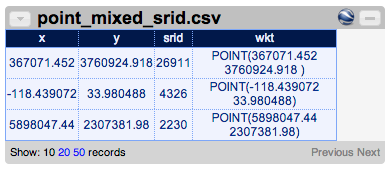
-
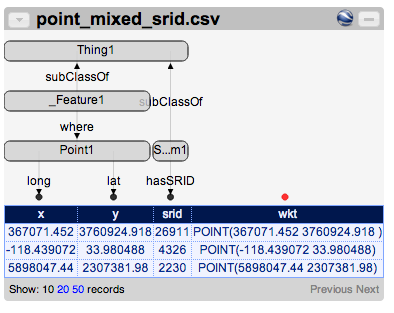
Model the “x” and “y” columns as longitude and latitude
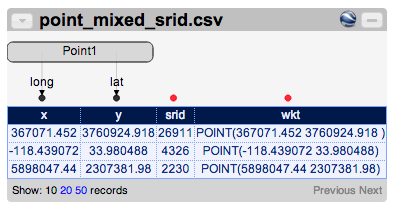
-
Model the “srid” column as follows:
-
Select “karma_geospatial:hasSRID” for the property of the semantic type
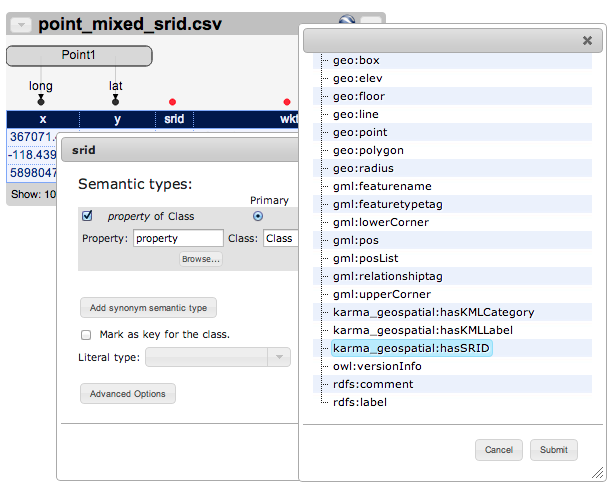
-
Select “karma_geospatial:SpatialReferenceSystem” for the class of the semantic type
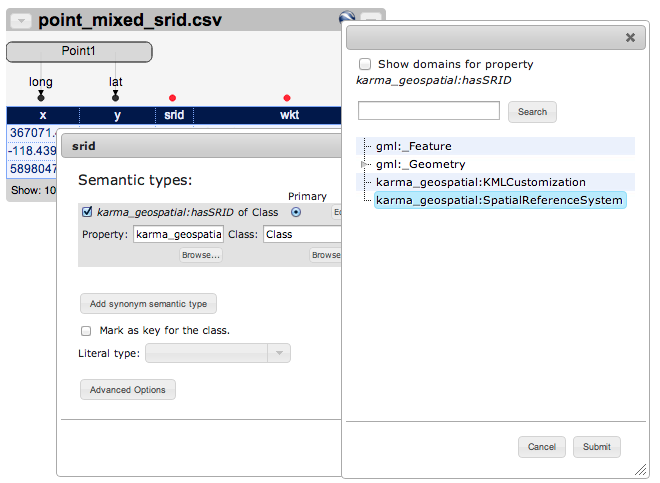
-
Modeling result
-
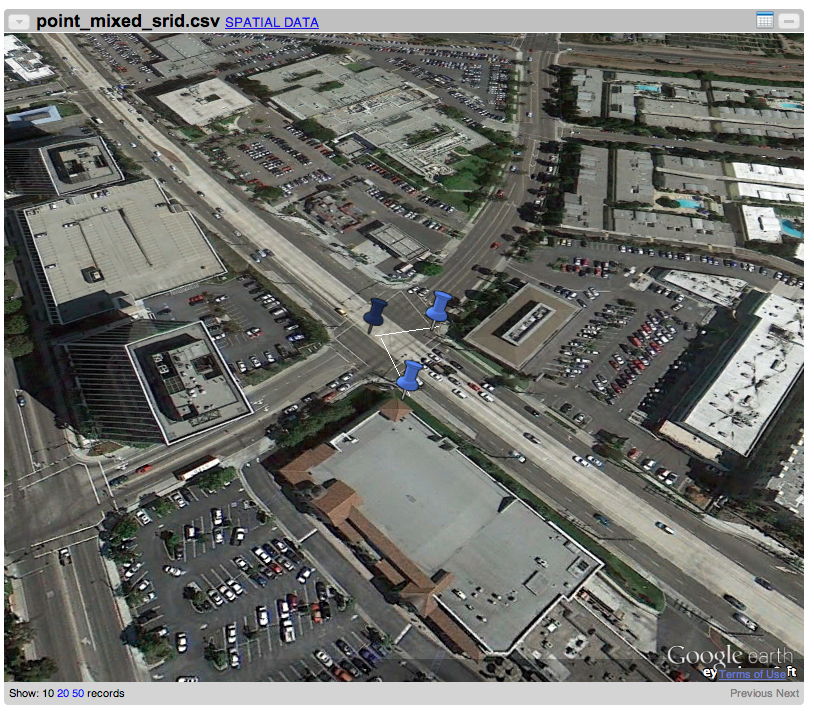
Click on the Google Earth icon to see your data in browser (optional, this function will send data to Google)
Example 2. Add a column to the worksheet to specify a SRID for your dataset (every row in your dataset use the same geocoordinate system)
-
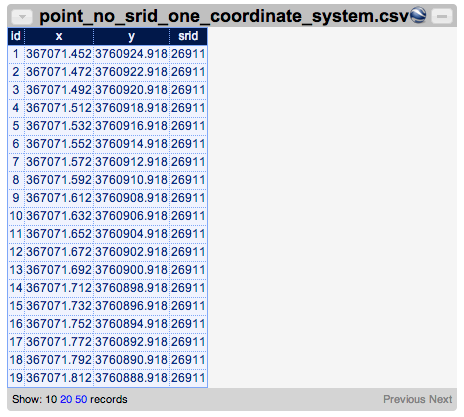
Import “point_no_srid_one_coordinate_system.csv” and then import “geo_2007.owl”

-
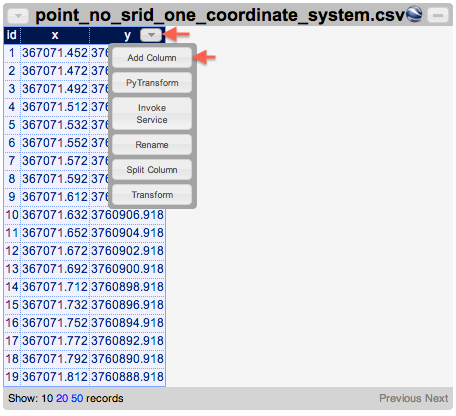
Click on the top-right corner of the last column of your worksheet and click on “Add Column”
-
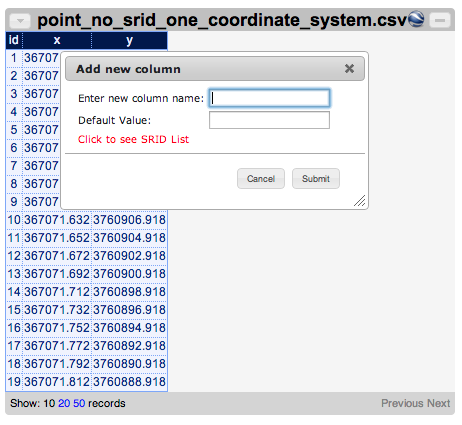
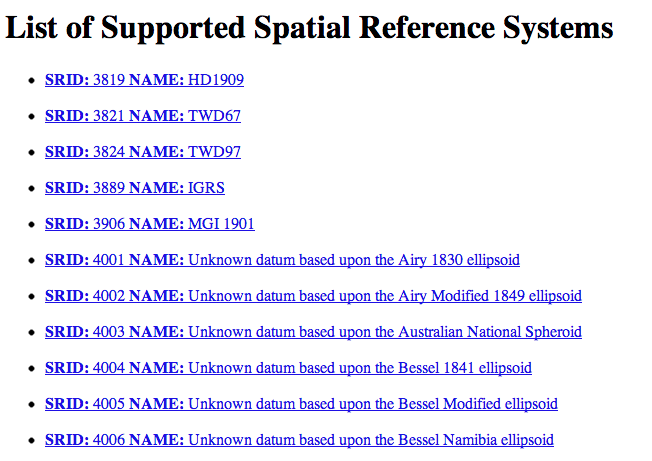
Click on the link “Click to see SRID List” to find the SRID that identifies the geocoordinate system of your datasets
-
Enter a name for this SRID column (you can use any text without space) and set the “Default Value” to the SRID you found

-
Model the worksheet

-
Click on the Google Earth icon to see your data in browser (optional, this function will send data to Google)

Example 3. Add a column to the worksheet to specify multiple SRID for your dataset (NOT every row in your dataset use the same geocoordinate system)
-
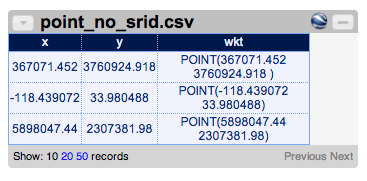
Import “point_no_srid.csv” and then import “geo_2007.owl”
-
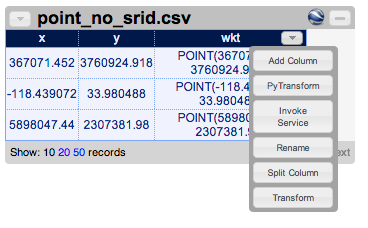
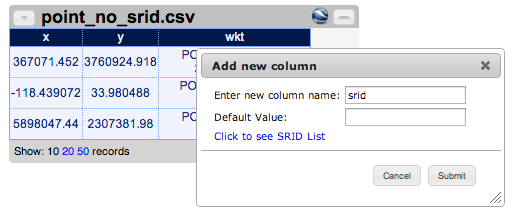
Click on the top-right corner of the last column of your worksheet and click on “Add Column”
-
Enter a name for this new column (you can use any text without space) and leave the “Default Value” empty
-
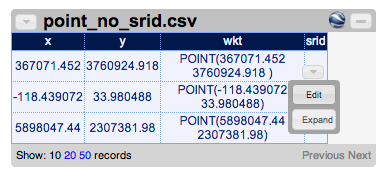
Click on the bottom-right corner of each cell in the new column click on “Edit”
-
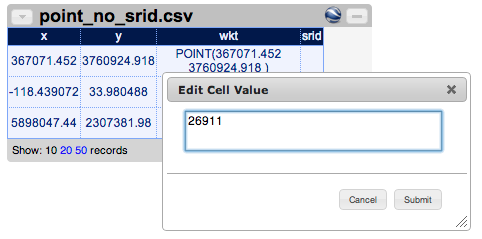
Enter the SRID for this row
-
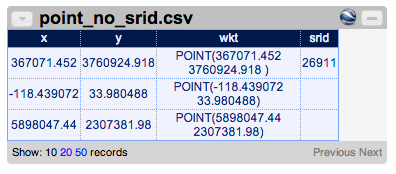
Add a SRID to every row and model worksheet
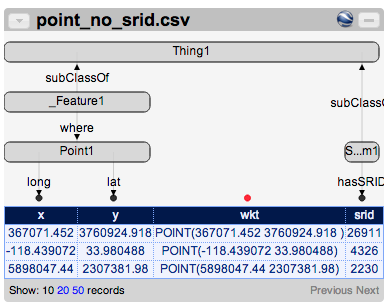
-
Click on the Google Earth icon to see your data in browser (optional, this function will send data to Google)
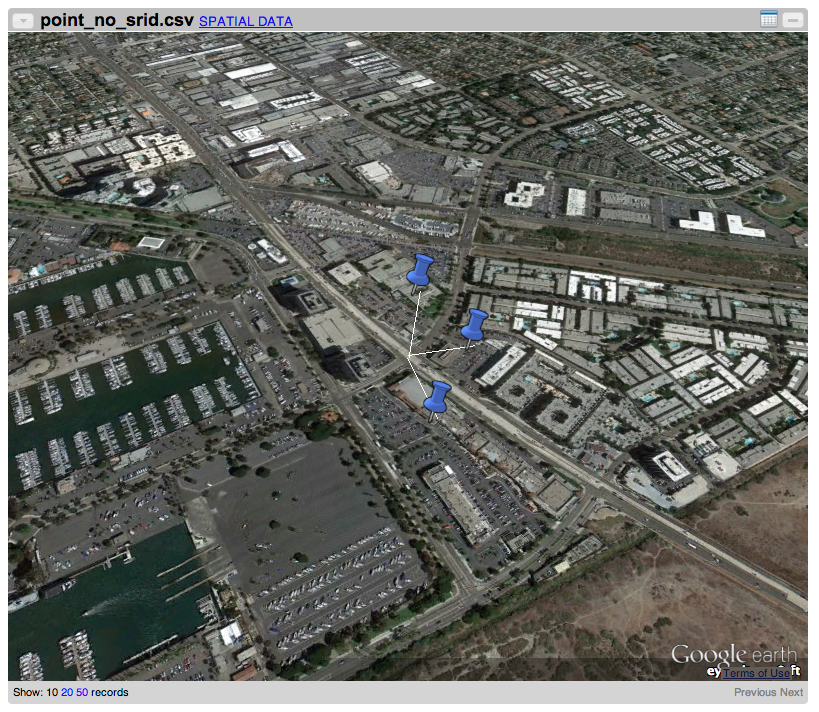
Export geospatial data to KML and Shapefiles
-
Import “Well_Data_Sheet1” and “geo_2007.owl” and then model your worksheet
-
Click on the top-left corner of your worksheet and click “Export to SpatialData”

-
Click on the “SPATIAL DATA” link to download the zipped KML and Shapefile

-
Unzip and open the KML file to see your result (optional)
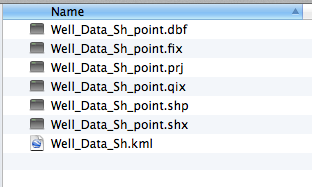
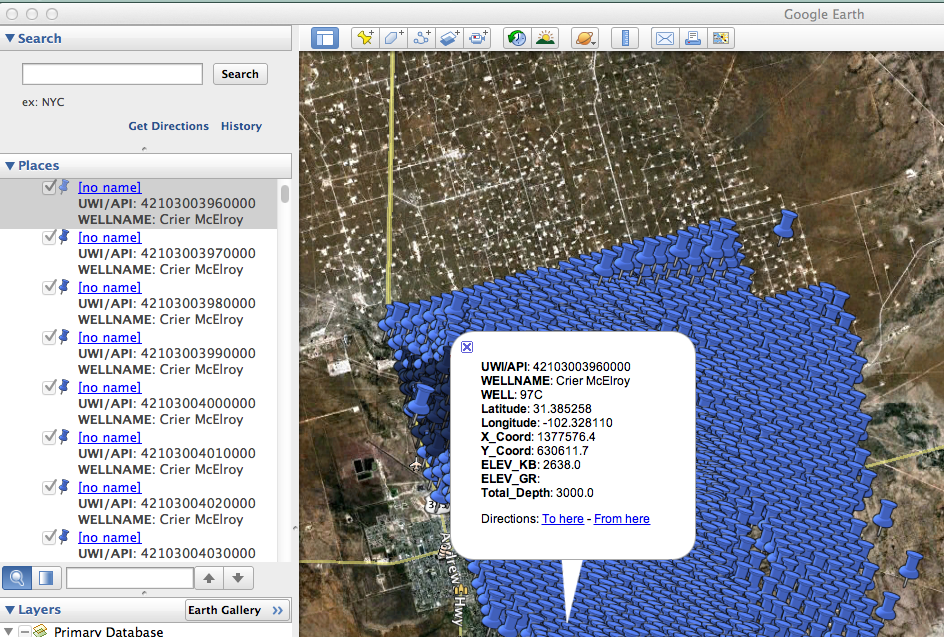
Export data to Access MDB
-
Import “Well_Data_Sheet1” and “geo_2007.owl” and then model your worksheet
-
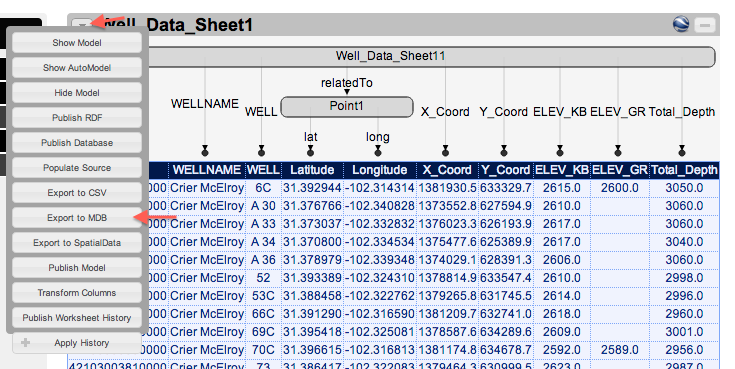
Click on the top-left corner of your worksheet and click “Export to MDB”
-
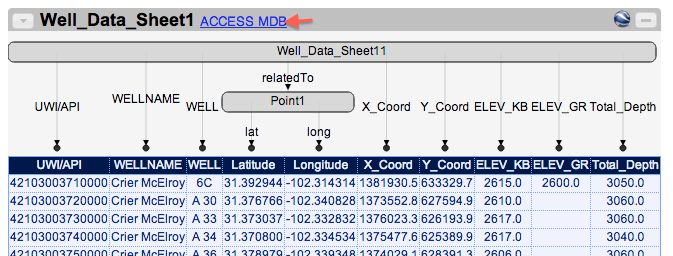
Click on the “ACCESS MDB” link to download the Access MDB file
Customize Feature Labels for KML
-
Import “Well_Data_Sheet1” and “geo_2007.owl” and then model your worksheet

-
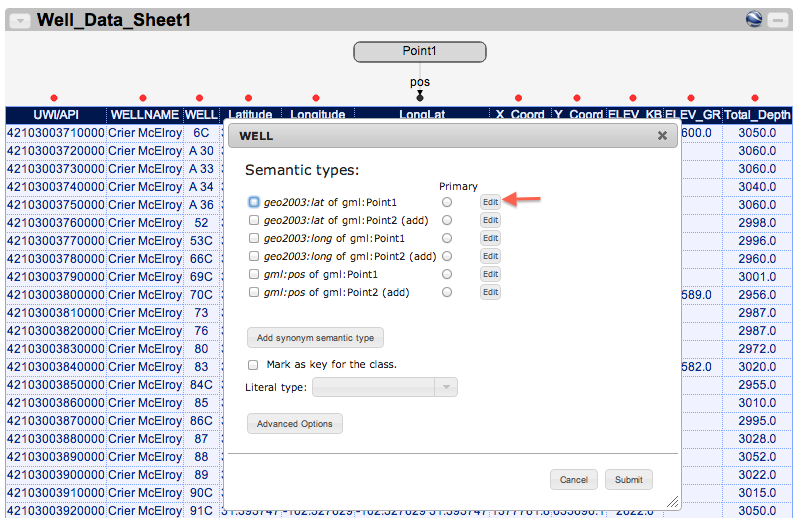
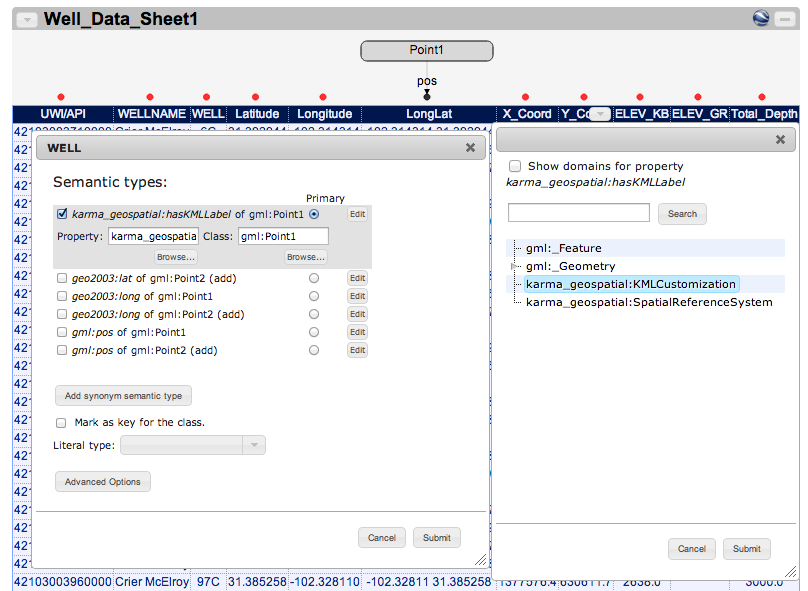
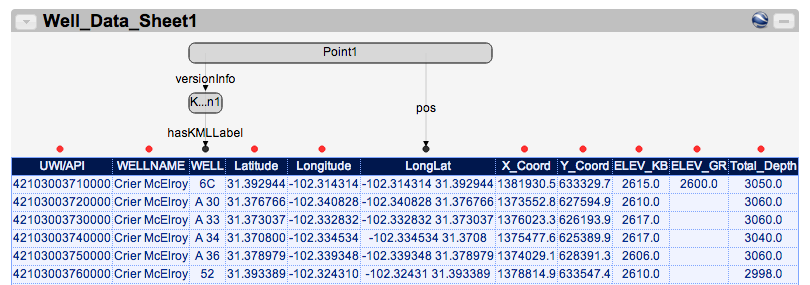
Click on the red dot on the column you will use as the “Label” in your KML file (we use the column “WELL” in this example)
-
Click “Edit” to modify the semantic type
-
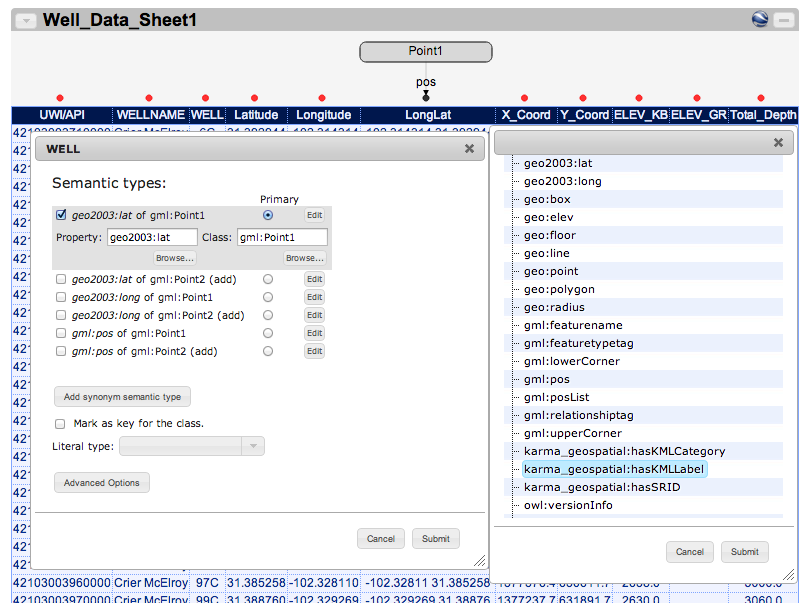
Select “karma_geospatial:hasKMLLabel” as the “Property”
-
Select “karma_geospatial:KMLCustomization” as the “Class”
-
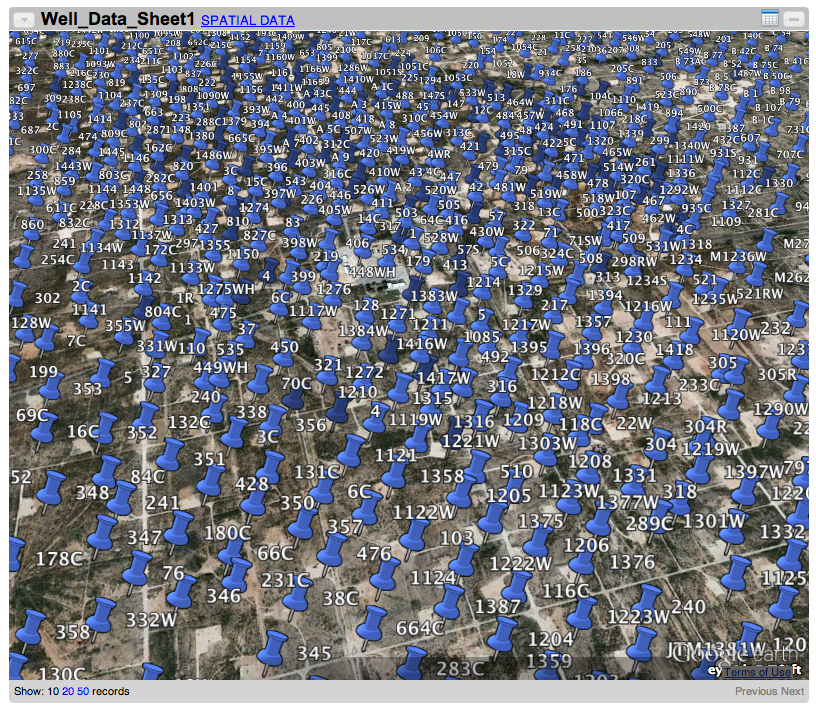
Click on the Google Earth icon to see your data in browser (optional, this function will send data to Google)
Customize Feature Icons for KML
-
Import “Well_Data_Sheet1” and “geo_2007.owl” and then model your worksheet
-
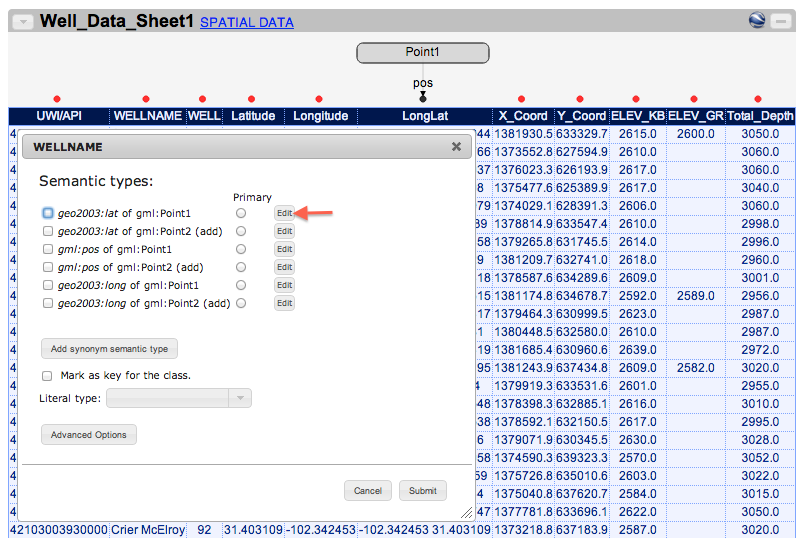
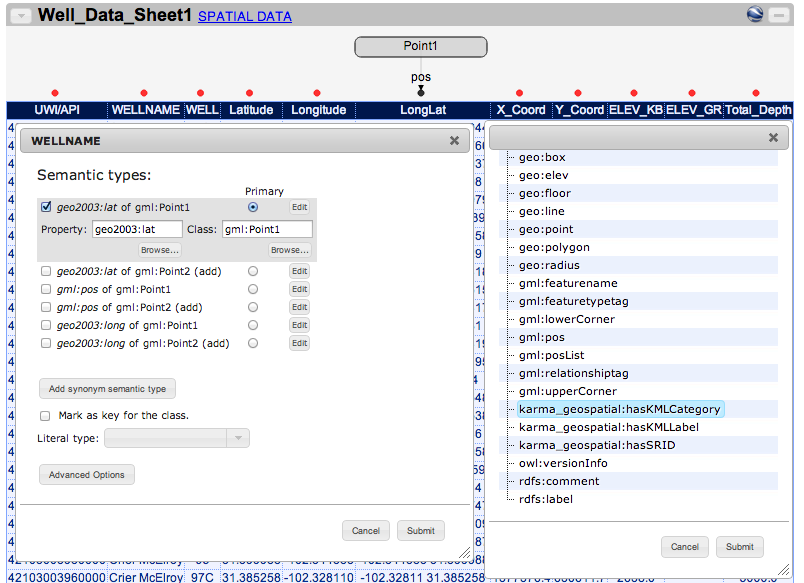
Click on the red dot on the column you will use to specify individual icon categories in your KML file (we use the column “WELLNAME” in this example)
-
Click “Edit” to modify the semantic type
-
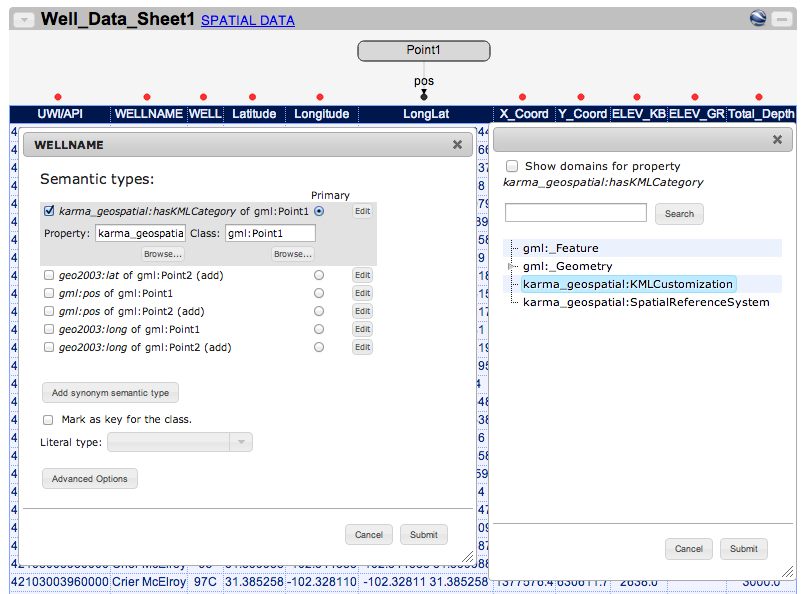
Select “karma_geospatial:hasKMCategory” as the “Property”
-
Select “karma_geospatial:KMLCustomization” as the “Class”

-
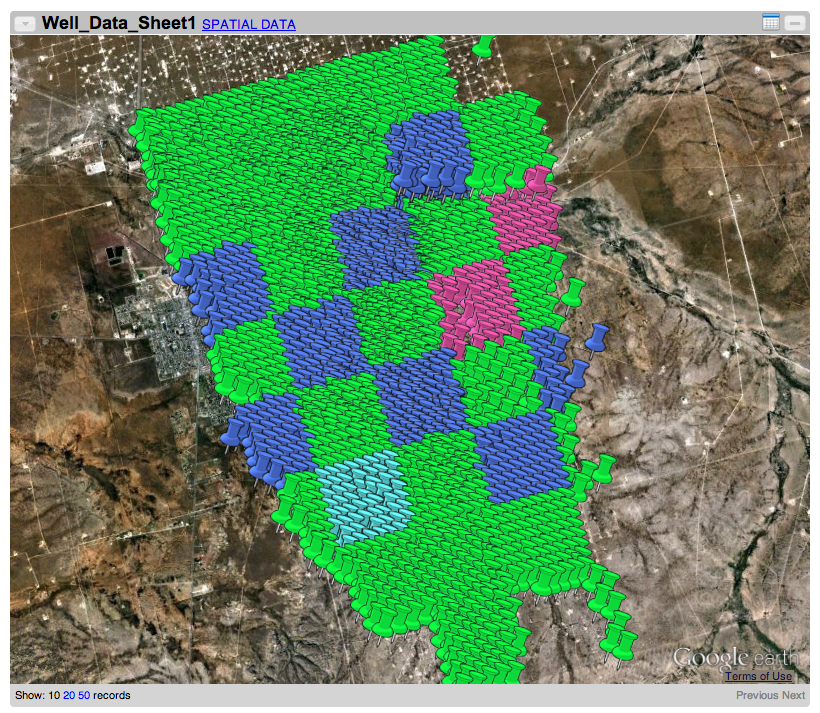
Click on the Google Earth icon to see your data in browser (optional, this function will send data to Google)
-
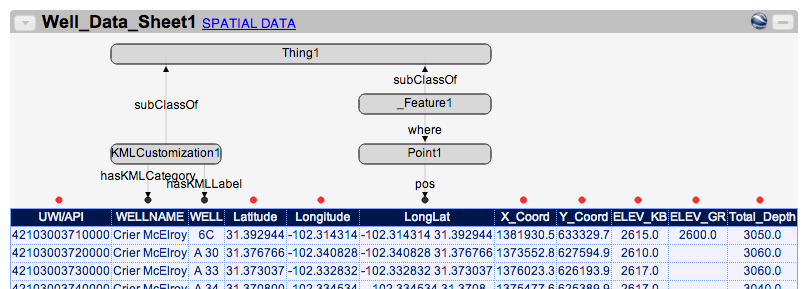
You can specify both the KML label and category at the same time
