forked from rafaqz/JuliaCon2024-Rasters
-
Notifications
You must be signed in to change notification settings - Fork 0
/
index.qmd
196 lines (166 loc) · 4.33 KB
/
index.qmd
1
2
3
4
5
6
7
8
9
10
11
12
13
14
15
16
17
18
19
20
21
22
23
24
25
26
27
28
29
30
31
32
33
34
35
36
37
38
39
40
41
42
43
44
45
46
47
48
49
50
51
52
53
54
55
56
57
58
59
60
61
62
63
64
65
66
67
68
69
70
71
72
73
74
75
76
77
78
79
80
81
82
83
84
85
86
87
88
89
90
91
92
93
94
95
96
97
98
99
100
101
102
103
104
105
106
107
108
109
110
111
112
113
114
115
116
117
118
119
120
121
122
123
124
125
126
127
128
129
130
131
132
133
134
135
136
137
138
139
140
141
142
143
144
145
146
147
148
149
150
151
152
153
154
155
156
157
158
159
160
161
162
163
164
165
166
167
168
169
170
171
172
173
174
175
176
177
178
179
180
181
182
183
184
185
186
187
188
189
190
191
192
193
194
---
title: "SpeciesDistributionModels.jl"
subtitle: "an SDM workflow"
author:
- name: Tiem van der Deure
orcid:
email: [email protected]
affiliation:
- name: University of Copenhagen
date: "2024-07-12"
engine: julia
format:
revealjs:
theme: [default, style.scss] # beige blood dark default league moon night serif simple sky solarized
incremental: false
toc: false
toc-depth: 1
slide-number: true
overview: true
code-line-numbers: false
highlight-style: ayu
include-in-header:
- text: |
<style>
#title-slide .title {
font-size: 2em;
}
</style>
execute:
echo: true
---
## What are Species Distribution Models?
:::: {.columns}
::: {.column width="60%"}

::: {style="font-size: 50%;"}
From: conservationbytes.com
:::
:::
::: {.column width="40%"}
- Use occurrence records and environmental variables
- Predict where a species can live
:::
::::
## What are Species Distribution Models?
- The main way to understand how climate change will affect nature
- A huge field of research with:
- Common standards
- Recurring problems
- Often-used data sources
## Current tools for SDMs
- Heavily reliant on R with dozens of R packages
- Pros:
- Very complete
- Beginner-friendly
- Documented
- Cons:
- Slow
- Not custumisable
- Idiosyncratic syntax
## Towards SDMs in Julia
- JuliaGeo
- E.g. Rasters.extract
- Models
- E.g. Maxnet
- PRs to MLJ
- SpeciesDistributionModels.jl
- Depends on MLJ and Rasters
- Aims to make Julia machine learning tools accessible for SDM users
## A typical SDM workflow
:::: {.columns}
::: {.column width="70%"}
- Load environmental data
- Load occurrence data
- Data wrangling
- Fit a model ensemble
- Evaluate the ensemble
- Predict
:::
::: {.column width="30%"}

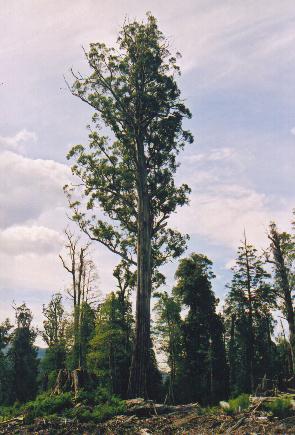
_Eucalyptus regnans_
:::
::::
## Environmental data
```{julia}
#| echo: false
if !haskey(ENV, "RASTERDATASOURCES_PATH")
ENV["RASTERDATASOURCES_PATH"] = ".";
end
using CairoMakie
CairoMakie.activate!(type = "png")
```
\
```{julia}
using Rasters, RasterDataSources, ArchGDAL, NaturalEarth, DataFrames
bio = RasterStack(WorldClim{BioClim}, (1,12))
countries = naturalearth("ne_10m_admin_0_countries") |> DataFrame
australia = subset(countries, :NAME => ByRow(==("Australia"))).geometry
bio_aus = Rasters.trim(mask(bio; with = australia)[X = 110 .. 156, Y = -45 .. -10])
```
## Environmental data
```{julia}
using CairoMakie
Rasters.rplot(bio_aus)
```
## Occurrence data
```{julia}
using GBIF2, SpeciesDistributionModels
sp = species_match("Eucalyptus regnans")
occurrences_raw = occurrence_search(sp; year = (1970,2000), country = "AU", hasCoordinate = true, limit = 2000)
occurrences = thin(occurrences_raw.geometry, 5000)
```
## Background points
```{julia}
using StatsBase
bg_indices = sample(findall(boolmask(bio_aus)), 500)
bg_points = DimPoints(bio_aus)[bg_indices]
fig, ax, pl = plot(bio_aus.bio1)
scatter!(ax, occurrences; color = :red)
scatter!(ax, bg_points; color = :grey)
fig
```
## Handling data
```{julia}
using SpeciesDistributionModels
p_data = extract(bio_aus, occurrences; skipmissing = true)
bg_data = bio_aus[bg_indices]
data = sdmdata(p_data, bg_data; resampler = CV(nfolds = 3))
```
## Fitting an ensemble
```{julia}
using Maxnet: MaxnetBinaryClassifier
using EvoTrees: EvoTreeClassifier
using MLJGLMInterface: LinearBinaryClassifier
models = (
maxnet = MaxnetBinaryClassifier(),
brt = EvoTreeClassifier(),
glm = LinearBinaryClassifier()
)
ensemble = sdm(data, models)
```
## Evaluating an ensemble
```{julia}
import SpeciesDistributionModels as SDM
ev = SDM.evaluate(ensemble; measures = (; auc, accuracy))
```
## Predicting
```{julia}
pred = SDM.predict(ensemble, bio_aus; reducer = mean)
plot(pred; colorrange = (0,1))
```
## Understanding the model
```{julia}
expl = SDM.explain(ensemble; method = ShapleyValues(8))
interactive_response_curves(expl)
```
## What is next for SDMs in Julia?
- SpeciesDistributionModels.jl is early stage
- We have:
- Easy interfacing with many models through MLJ
- Easy access to raster data and operations
- We need:
- Documentation and tutorials
- All commonly used tools (e.g. GAMs)
- Very intuitive and consistent syntax