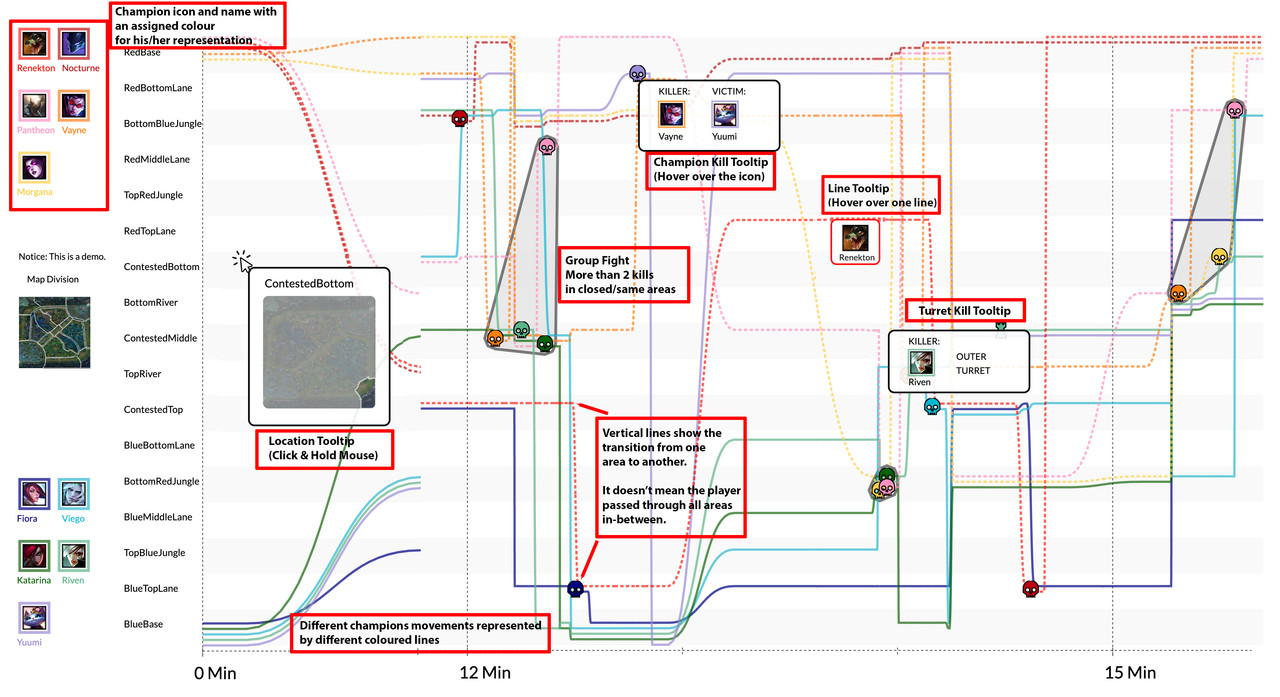
Players increasingly adopt a data-driven approach to review and improve their gaming skills. In the wake of this, spatio-temporal visualizations gained popularity but remain challenging to design. Storyline visualizations are unique in the way they integrate time and location information into a single view to show how entity relationships develop over time. We adopt the storyline visualization technique to summarize gameplay for the purpose of post-play review.
For more details, check our paper.
As for now, this web app supports visualizing the following information:
- Basic player information (which champion is used for which team)
- Players' positions in 1 minute intervals
- Players' kills and deaths
- Tower kills
- Areas on a map reflected on y-axis (e.g. jungle)
This app would also allow user to get detailed information of each event by hovering over the event/storylines. An example of storyline visualization for a League of Legends match is shown below:
Use the package manager npm or yarn to install iStoryline.
npm install i-storyline-jsor
yarn add i-storyline-jsimport iStoryline from "i-storyline-js"
let iStoryliner = new iStoryline();
// generate storyline visualizations from the story script
let storyScriptUrl = './data/xml/Redcap.xml';
// graph can be drawed using any canvas or svg libraries
let graph = iStoryliner.load(storyScriptUrl);
// obtain the characters names
console.log(graph.characters); // ['Red cap', 'Mother', 'Wolf', 'GrandMa']
// obtain the paths of the characters
console.log(graph.storylines); // [[[x1, y1], [x2, y2], ...], ...]First using our python project to fetch the match data and convert it into a storyline json file. This will ultimately gives you match spatio-temporal data, general match information file, a killing info file and a DBSCAN result. For this, check our Lol_Storyline Data project and follow the instructions there.
You should put your visualization instance javascript file under the /app/js folder. You should also check the /data/json/Match
folder to see the data files that are used in the storyline visualisation.
To create a new match visualization instance, you can start copying one file from the /app/js folder, rename it and make changes as following:
// adding match info to the storyline (fetched from Riot API)
const jsonRead = d3Fetch.json('../../data/json/xxx.json')

// adding killing info file generated by python
const jsonReadTwo = d3Fetch.json('../../data/json/xxx.json')

// adding DBSCAN result file generated by python
const jsonDBSCAN = d3Fetch.json('../../data/json/xxx.json')

// adding the match data generated by python for parsing
main('xxx.json');
Please then check and modify the webpack config file for new entry.
iStoryline.js provides a build-in editor for producing storyline visualizations.
-
Install Node.js (>= 10.0)
-
Install dependencies
npm ioryarn -
Start the editor
npm run start -
Please visit localhost:8080
- G. Wallner, L. Wang, and C. Dormann. "Visualizing the Spatio-Temporal Evolution of Gameplay using Storyline Visualization: A Study with League of Legends. Proc. ACM Hum.-Comput. Interact.", 7(CHI PLAY):412, 2023.
- T. Tang, S. Rubab, J. Lai, W. Cui, L. Yu, and Y. Wu. "iStoryline: Effective Convergence to Hand-drawn Storylines. IEEE Transactions on Visualization and Computer Graphics", 25(1):769-778, 2019.
- S. Liu, Y. Wu, E. Wei, M. Liu, and Y. Liu. "StoryFlow: Tracking the Evolution of Stories. IEEE Transactions on Visualization and Computer Graphics", 19(12):2436–2445, 2013.
We appreciate your citation if this GitHub repo contributes to your work.
@article{10.1145/3611058,
author = {Wallner, G\"{u}nter and Wang, Letian and Dormann, Claire},
title = {Visualizing the Spatio-Temporal Evolution of Gameplay using Storyline Visualization: A Study with League of Legends},
year = {2023},
issue_date = {November 2023},
publisher = {Association for Computing Machinery},
address = {New York, NY, USA},
volume = {7},
number = {CHI PLAY},
url = {https://doi.org/10.1145/3611058},
doi = {10.1145/3611058},
abstract = {Players increasingly adopt a data-driven approach to review and improve their gaming skills. In the wake of this, spatio-temporal visualizations gained popularity but remain challenging to design. Storyline visualizations are unique in the way they integrate time and location information into a single view to show how entity relationships develop over time. We adopt the storyline visualization technique to summarize gameplay for the purpose of post-play review. We demonstrate the method by applying it to League of Legends matches and evaluated it with 39 players of the game in a task-based online study using the triad framework for spatio-temporal queries by Peuquet. Results indicate that players responded positively to the approach and could, by and large, solve tasks well but that time-based tasks proved most challenging and least efficient to solve. Based on our findings, we reflect on possibilities for enhancing the design of storyline visualizations for game-related data analysis.},
journal = {Proc. ACM Hum.-Comput. Interact.},
month = {oct},
articleno = {412},
numpages = {23},
keywords = {League of Legends, Player-centric visualization, match analysis, storyline visualization}
}Licensed under the Apache License, Version 2.0 (the "License");
you may not use this file except in compliance with the License.
You may obtain a copy of the License at
http://www.apache.org/licenses/LICENSE-2.0
Unless required by applicable law or agreed to in writing, software
distributed under the License is distributed on an "AS IS" BASIS,
WITHOUT WARRANTIES OR CONDITIONS OF ANY KIND, either express or implied.
See the License for the specific language governing permissions and
limitations under the License.
