Table of Contents
It is highly recommended to go over the getting started in 5 minutes - ASP.NET Core Application guide or the getting started in 5 minutes - Console Application guide before following along this document.
Create a new console application and run it:
dotnet new console --output getting-started-jaeger
cd getting-started-jaeger
dotnet run
Add reference to Console Exporter, OTLP Exporter and HttpClient Instrumentation:
dotnet add package OpenTelemetry.Exporter.Console
dotnet add package OpenTelemetry.Exporter.OpenTelemetryProtocol
dotnet add package OpenTelemetry.Instrumentation.Http
Now copy the code from Program.cs.
Run the application again and we should see the trace output from the console:
> dotnet run

Activity.TraceId:            693f1d15634bfe6ba3254d6f9d20df27
Activity.SpanId:             429cc5a90a753fb3
Activity.TraceFlags:         Recorded
Activity.ParentSpanId:       0d64498b736c9a11
Activity.ActivitySourceName: System.Net.Http
Activity.DisplayName:        GET
Activity.Kind:               Client
Activity.StartTime:          2024-07-04T13:18:12.2408786Z
Activity.Duration:           00:00:02.1028562
Activity.Tags:
    http.request.method: GET
    server.address: httpstat.us
    server.port: 443
    url.full: https://httpstat.us/200?sleep=Redacted
    network.protocol.version: 1.1
    http.response.status_code: 200
Resource associated with Activity:
    service.name: DemoApp
    service.version: 1.0.0
    service.instance.id: 03ccafab-e9a7-440a-a9cd-9a0163e0d06c
    telemetry.sdk.name: opentelemetry
    telemetry.sdk.language: dotnet
    telemetry.sdk.version: 1.9.0
...
Note that we have configured two exporters in the code:
using var tracerProvider = Sdk.CreateTracerProviderBuilder()
    ...
    .AddConsoleExporter()
    .AddOtlpExporter()
    .Build();
When we ran the application, the ConsoleExporter was printing the traces on
console, and the OtlpExporter was attempting to send the traces to Jaeger
Agent via the default endpoint http://localhost:4317.
Since we didn't have Jaeger running, the traces received by OtlpExporter
were simply dropped on the floor. In the next step, we are going to learn about
how to use Jaeger to collect and visualize the traces.
graph LR

subgraph SDK
  TracerProvider
  SimpleExportProcessor["SimpleExportProcessor < Activity >"]
  BatchExportProcessor["BatchExportProcessor < Activity >"]
  ConsoleExporter
  OtlpExporter
end

subgraph API
  ActivitySource["ActivitySource(#quot;MyCompany.MyProduct.MyLibrary#quot;)"]
end

ActivitySource --> | System.Diagnostics.Activity | TracerProvider

TracerProvider --> | System.Diagnostics.Activity | SimpleExportProcessor --> | Batch | ConsoleExporter

TracerProvider --> | System.Diagnostics.Activity | BatchExportProcessor --> | Batch | OtlpExporter
Download the latest binary distribution archive of Jaeger.
After finished downloading, extract it to a local location that's easy to
access. Run the jaeger-all-in-one(.exe) executable:
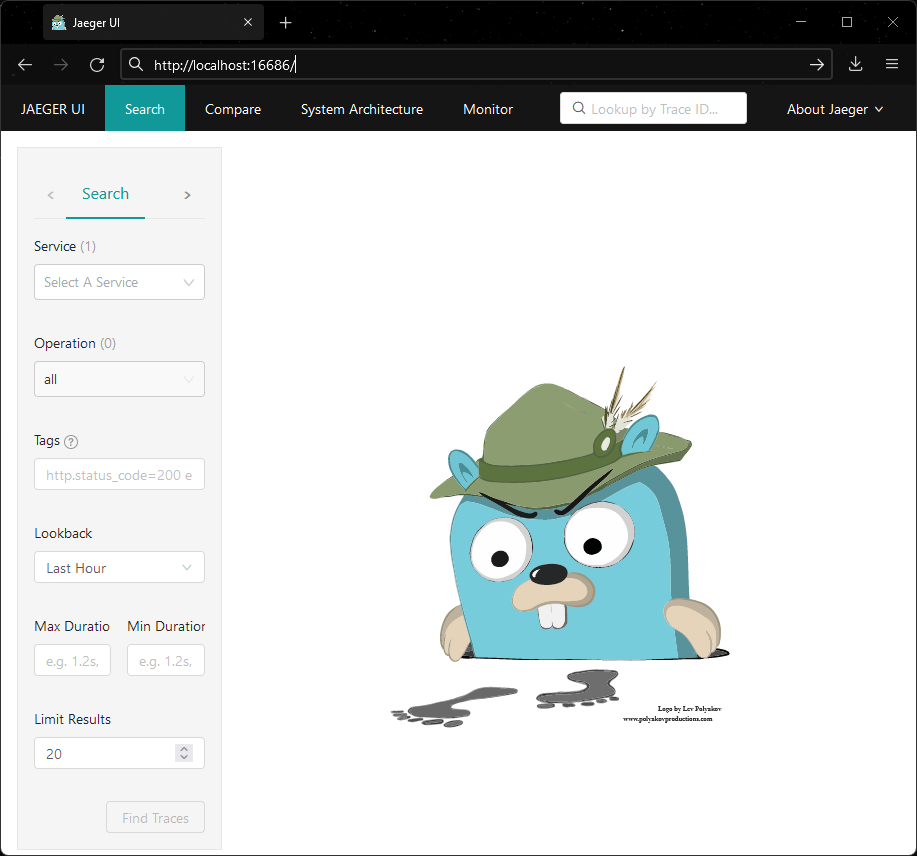
./jaeger-all-in-one --collector.otlp.enabledNow we should be able to see the Jaeger UI at http://localhost:16686/ from a web browser:
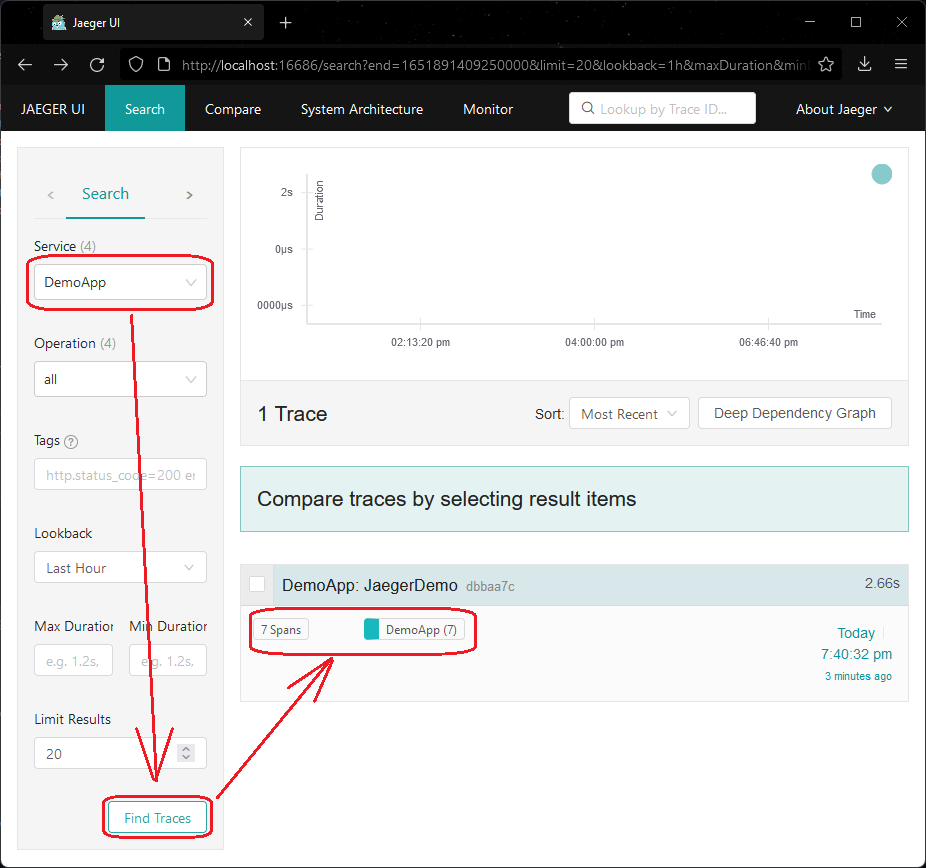
Run the application again and refresh the web page, we should be able to see the traces now:
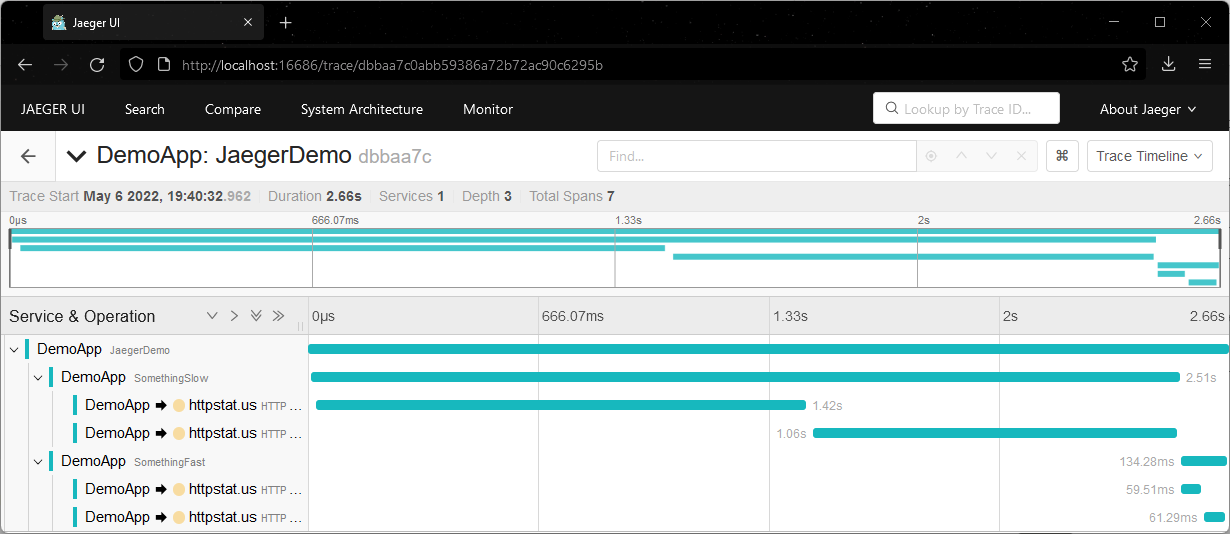
Click on the individual trace to see the Gantt Chart:
graph TD

OtlpExporter["OtlpExporter"] --> |http://localhost:4317| Jaeger
Jaeger -->|http://localhost:16686/| JaegerUI["Browser<br/>(Jaeger UI)"]
In the end, remove the Console Exporter so we only have OTLP Exporter in the final application:
using var tracerProvider = Sdk.CreateTracerProviderBuilder()
    ...
    // Remove Console Exporter from the final application
    // .AddConsoleExporter()
    .AddOtlpExporter()
    .Build();
dotnet remove package OpenTelemetry.Exporter.Consolegraph LR
subgraph SDK
TracerProvider
BatchExportProcessor["BatchExportProcessor < Activity >"]
OtlpExporter
end
subgraph API
ActivitySource["ActivitySource(#quot;MyCompany.MyProduct.MyLibrary#quot;)"]
end
ActivitySource --> | System.Diagnostics.Activity | TracerProvider --> | System.Diagnostics.Activity | BatchExportProcessor
BatchExportProcessor --> | Batch | OtlpExporter


