You signed in with another tab or window. Reload to refresh your session.You signed out in another tab or window. Reload to refresh your session.You switched accounts on another tab or window. Reload to refresh your session.Dismiss alert
Would it be possible to provide a simple time-series example?
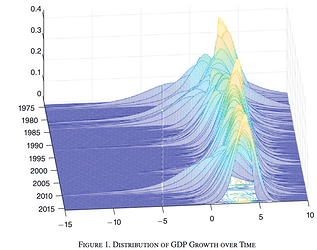
For example, a recent paper makes 1 year ahead predictions for the distribution of GDP growth, with current GDP growth & NFCI as conditioning variables. Their data & Matlab code is here.
Here are the predicted distributions:
To rephrase:
target variable y_{t+1} = GDP_Growth_{t+1}
predictors X_t =(y_t, NFCI_t) = (GDP_Growth_{t}, NFCI_t)
Goal: predict the conditional distribution P(y_{t+1} | y_{t}, NFCI_t )
Their strategy is to use quantile regression. Ngboost.py would be amazing for this!
Here is the publicly available quarterly data:
t
Y_t+1 (=GDP_Growth_t+1)
x1_t (=Y_t)
x2_t (=NFCI_t)
1973-01-01
4.6
10.2
0.46
1973-04-01
-2.2
4.6
0.91
1973-07-01
3.8
-2.2
1.67
1973-10-01
-3.3
3.8
1.79
1974-01-01
1.1
-3.3
0.71
1974-04-01
-3.8
1.1
2.64
1974-07-01
-1.6
-3.8
4.24
1974-10-01
-4.7
-1.6
2.57
1975-01-01
3.1
-4.7
0.94
1975-04-01
6.8
3.1
-0.29
1975-07-01
5.5
6.8
-0.5
1975-10-01
9.3
5.5
-0.25
1976-01-01
3.1
9.3
-0.81
1976-04-01
2.1
3.1
-0.75
1976-07-01
3
2.1
-0.84
1976-10-01
4.7
3
-0.8
1977-01-01
8.1
4.7
-0.88
1977-04-01
7.3
8.1
-0.62
1977-07-01
0
7.3
-0.44
1977-10-01
1.4
0
-0.17
1978-01-01
16.5
1.4
-0.11
1978-04-01
4
16.5
0.38
1978-07-01
5.5
4
0.54
1978-10-01
0.8
5.5
1.54
1979-01-01
0.5
0.8
0.83
1979-04-01
2.9
0.5
0.58
1979-07-01
1
2.9
1.36
1979-10-01
1.3
1
2.16
1980-01-01
-7.9
1.3
2.22
1980-04-01
-0.6
-7.9
2.79
1980-07-01
7.6
-0.6
0.93
1980-10-01
8.5
7.6
2.22
1981-01-01
-2.9
8.5
2.24
1981-04-01
4.7
-2.9
2.32
1981-07-01
-4.6
4.7
3.1
1981-10-01
-6.5
-4.6
2.35
1982-01-01
2.2
-6.5
1.87
1982-04-01
-1.4
2.2
2.27
1982-07-01
0.4
-1.4
2.84
1982-10-01
5.3
0.4
1.48
1983-01-01
9.4
5.3
0.14
1983-04-01
8.1
9.4
-0.14
1983-07-01
8.5
8.1
-0.11
1983-10-01
8.2
8.5
0.02
1984-01-01
7.2
8.2
-0.14
1984-04-01
4
7.2
0.6
1984-07-01
3.2
4
0.66
1984-10-01
4
3.2
-0.03
1985-01-01
3.7
4
-0.41
1985-04-01
6.4
3.7
-0.43
1985-07-01
3
6.4
-0.3
1985-10-01
3.8
3
-0.3
1986-01-01
1.9
3.8
-0.27
1986-04-01
4.1
1.9
-0.4
1986-07-01
2.1
4.1
-0.35
1986-10-01
2.8
2.1
-0.43
1987-01-01
4.6
2.8
-0.42
1987-04-01
3.7
4.6
0.25
1987-07-01
6.8
3.7
0.02
1987-10-01
2.3
6.8
0.76
1988-01-01
5.4
2.3
0.21
1988-04-01
2.3
5.4
0.16
1988-07-01
5.4
2.3
0.27
1988-10-01
4.1
5.4
0.12
1989-01-01
3.2
4.1
0.3
1989-04-01
3
3.2
0.39
1989-07-01
0.9
3
0.19
1989-10-01
4.5
0.9
0.08
1990-01-01
1.6
4.5
0.02
1990-04-01
0.1
1.6
-0.04
1990-07-01
-3.4
0.1
0.04
1990-10-01
-1.9
-3.4
0.37
1991-01-01
3.1
-1.9
0.13
1991-04-01
1.9
3.1
-0.26
1991-07-01
1.8
1.9
-0.47
1991-10-01
4.8
1.8
-0.55
1992-01-01
4.5
4.8
-0.61
1992-04-01
3.9
4.5
-0.76
1992-07-01
4.1
3.9
-0.8
1992-10-01
0.8
4.1
-0.63
1993-01-01
2.4
0.8
-0.83
1993-04-01
2
2.4
-0.9
1993-07-01
5.4
2
-1
1993-10-01
4
5.4
-0.91
1994-01-01
5.6
4
-0.89
1994-04-01
2.4
5.6
-0.68
1994-07-01
4.6
2.4
-0.72
1994-10-01
1.4
4.6
-0.5
1995-01-01
1.4
1.4
-0.55
1995-04-01
3.5
1.4
-0.65
1995-07-01
2.9
3.5
-0.64
1995-10-01
2.7
2.9
-0.68
1996-01-01
7.2
2.7
-0.7
1996-04-01
3.7
7.2
-0.64
1996-07-01
4.3
3.7
-0.66
1996-10-01
3.1
4.3
-0.68
1997-01-01
6.2
3.1
-0.64
1997-04-01
5.2
6.2
-0.61
1997-07-01
3.1
5.2
-0.61
1997-10-01
4
3.1
-0.47
1998-01-01
3.9
4
-0.59
1998-04-01
5.3
3.9
-0.59
1998-07-01
6.7
5.3
-0.39
1998-10-01
3.2
6.7
-0.02
1999-01-01
3.3
3.2
-0.3
1999-04-01
5.1
3.3
-0.41
1999-07-01
7.1
5.1
-0.18
1999-10-01
1.2
7.1
-0.14
2000-01-01
7.8
1.2
-0.21
2000-04-01
0.5
7.8
-0.04
2000-07-01
2.3
0.5
-0.19
2000-10-01
-1.1
2.3
-0.15
2001-01-01
2.1
-1.1
-0.23
2001-04-01
-1.3
2.1
-0.37
2001-07-01
1.1
-1.3
-0.44
2001-10-01
3.7
1.1
-0.32
2002-01-01
2.2
3.7
-0.44
2002-04-01
2
2.2
-0.59
2002-07-01
0.3
2
-0.37
2002-10-01
2.1
0.3
-0.37
2003-01-01
3.8
2.1
-0.45
2003-04-01
6.9
3.8
-0.69
2003-07-01
4.8
6.9
-0.65
2003-10-01
2.3
4.8
-0.69
2004-01-01
3
2.3
-0.79
2004-04-01
3.7
3
-0.74
2004-07-01
3.5
3.7
-0.71
2004-10-01
4.3
3.5
-0.73
2005-01-01
2.1
4.3
-0.73
2005-04-01
3.4
2.1
-0.63
2005-07-01
2.3
3.4
-0.63
2005-10-01
4.9
2.3
-0.61
2006-01-01
1.2
4.9
-0.66
2006-04-01
0.4
1.2
-0.66
2006-07-01
3.2
0.4
-0.63
2006-10-01
0.2
3.2
-0.68
2007-01-01
3.1
0.2
-0.72
2007-04-01
2.7
3.1
-0.64
2007-07-01
1.4
2.7
-0.05
2007-10-01
-2.7
1.4
0.32
2008-01-01
2
-2.7
0.6
2008-04-01
-1.9
2
0.59
2008-07-01
-8.2
-1.9
0.89
2008-10-01
-5.4
-8.2
2.75
2009-01-01
-0.5
-5.4
1.84
2009-04-01
1.3
-0.5
0.91
2009-07-01
3.9
1.3
0.28
2009-10-01
1.7
3.9
-0.02
2010-01-01
3.9
1.7
-0.27
2010-04-01
2.7
3.9
-0.26
2010-07-01
2.5
2.7
-0.27
2010-10-01
-1.5
2.5
-0.42
2011-01-01
2.9
-1.5
-0.48
2011-04-01
0.8
2.9
-0.5
2011-07-01
4.6
0.8
-0.15
2011-10-01
2.7
4.6
0.01
2012-01-01
1.9
2.7
-0.34
2012-04-01
0.5
1.9
-0.37
2012-07-01
0.1
0.5
-0.48
2012-10-01
2.8
0.1
-0.63
2013-01-01
0.8
2.8
-0.73
2013-04-01
3.1
0.8
-0.75
2013-07-01
4
3.1
-0.72
2013-10-01
-1.2
4
-0.87
2014-01-01
4
-1.2
-0.9
2014-04-01
5
4
-0.93
2014-07-01
2.3
5
-0.91
2014-10-01
2
2.3
-0.81
2015-01-01
2.6
2
-0.71
2015-04-01
2
2.6
-0.8
2015-07-01
0.9
2
-0.72
2015-10-01
0.8
0.9
-0.71
2016-01-01
1.4
0.8
-0.61
2016-04-01
3.2
1.4
-0.67
The text was updated successfully, but these errors were encountered:
Hi and thank you for this awesome package!
Would it be possible to provide a simple time-series example?
For example, a recent paper makes 1 year ahead predictions for the distribution of GDP growth, with current GDP growth & NFCI as conditioning variables. Their data & Matlab code is here.
Here are the predicted distributions:

To rephrase:
target variable y_{t+1} = GDP_Growth_{t+1}
predictors X_t =(y_t, NFCI_t) = (GDP_Growth_{t}, NFCI_t)
Goal: predict the conditional distribution P(y_{t+1} | y_{t}, NFCI_t )
Their strategy is to use quantile regression. Ngboost.py would be amazing for this!
Here is the publicly available quarterly data:
The text was updated successfully, but these errors were encountered: