By Rowan van der Kaaden
Socio-spatial differentiation refers to the unequal distribution of social groups and resources across space. It recognizes that cities and other geographic areas are not homogeneous entities, but rather consist of diverse neighborhoods, districts, or zones that are characterized by distinct social, economic, and cultural features. These areas can be differentiated based on factors such as income levels, educational attainment, employment opportunities, housing conditions, access to amenities and services, and racial or ethnic composition.
This spatial segregation can lead to disparities in quality of life, opportunities, and social interactions between different social groups. Socio-spatial differentiation often reflects patterns of social inequality and segregation within a society. Certain groups may concentrate in specific areas due to historical, economic, or cultural factors, while others may be excluded or marginalized from accessing certain spaces or resources.
Understanding socio-spatial differentiation is important for analyzing and addressing social inequalities and urban development challenges. It helps identify areas that may be experiencing higher levels of deprivation or exclusion, and informs policies and interventions aimed at promoting more inclusive and equitable spatial patterns within cities and regions.

GIS is a powerful tool that can be used to analyze and understand socio-spatial differentiation. By integrating spatial data with social and demographic information, GIS enables researchers and planners to examine the relationships between different social groups and the spaces they occupy.
GIS can provide visual representations of socio-spatial patterns, allowing for the identification of concentrations, disparities, and spatial dynamics within a given area. It can map variables such as income levels, educational attainment, or racial composition, allowing for the visualization of spatial variations and patterns of social differentiation. GIS can also integrate additional layers of information, such as transportation networks, amenities, and services, to better understand the spatial dimensions of social inequality and access to resources.
With GIS, it is possible to conduct spatial analyses and modeling to assess the impacts of socio-spatial differentiation on various aspects of urban life. For example, researchers can examine the relationship between neighborhood characteristics and health outcomes, educational opportunities, or crime rates. GIS can also assist in identifying areas of social exclusion, helping policymakers target interventions and resources to address spatial inequalities and promote more inclusive development.
Furthermore, GIS allows for the monitoring and evaluation of policies and interventions aimed at reducing socio-spatial differentiation. By analyzing spatial data over time, planners can assess the effectiveness of urban development strategies and determine whether they contribute to more equitable spatial patterns and improved social outcomes.
 Geographical distribution of relative wellbeing in the Tampere City Region in 2017. The map depicts the two lowest and two highest levels (lowest and highest quintiles) of wellbeing in grid cells based on unemployment rates, median income of inhabitants, and proportion of highly educated people in the respective grid cells.2
Another example of an socio-spatial differentiation study using GIS can be found here: https://helda.helsinki.fi/handle/10138/301865
The exercise accompanying this theory section consists of a GIS socio-spatial differentiation analysis. We will be using the Statistics Finland's Grid Database, which as the name suggests consists of a grid of cells, each of which describes various statistics of the area it covers. In this exercise specifically we will be looking at a 250x250m scale at the spatial distribution of level of education and income in Helsinki.
You can access the dataset here: https://www.tilastokeskus.fi/tup/ruututietokanta/index_en.html
We learned previously that raster data consists of a continuous surface divided into a grid of cells, where each cell corresponds to a specific location and contains a value representing a particular attribute. This value is represented by the color of the cell, images are in a way rasters as well, specifically JPEG, PNG, and GIF images. Do you remember seeing in movies that they store data in pictures? This is not unrealistic, as you could just see pictures as a raster where the color of each cell represents its value. While the Statistics Finland's Grid Database is practically raster data, it is in vector form, as you will see when you do the exercise. This is important to keep in mind in the future, since this type of data may look like a raster, it needs to be processed using vector methods. While doing the exercise, ask yourself questions like: Do I need my data to be vector or raster? What type of data is this? How do I process this data?
A regular necessary step in GIS is to prepare data for our analysis, the same can be said for this analysis. As you will see in the data during the exercise, some of the values are -1, which can't be true when we're talking about the statistics of people within an area. -1 in this dataset stands for no data available, which can be for several reasons, but in this case is due to privacy measures. If an area covered by a cell has a very small population, it would be very easy to identify which statistics correspond to which individual. For this reason, grids that have less than 10 inhabitants have been specifically removed from the available dataset to prevent privacy violations.
But what happens if we do an analysis without excluding these -1 values? This depends on the analysis of course, but in this case the analysis would be flawed. We will be looking at value ranges, and these would be incorrect if the starting value would be -1. Don't worry much about this for now however, it will make more sense after the exercise. But ask yourself the question at the end of the exercise, what effect would it have had if I didn't exclude the -1 values
There are other reasons why we might need to prepare the data, such as:

In our case we will be using expressions to select the data we want, the entries where our selected fields don't contain -1, and export them into a new file. There are other ways of data preparation, here are the typical processes involved in preparing data for GIS analysis:

Data classification refers to the process of categorizing or grouping data based on common characteristics, attributes, or criteria. It involves organizing data into distinct classes or categories to facilitate analysis, interpretation, and communication of information.
In the context of GIS (Geographic Information System), data classification is often applied to spatial data, such as maps or remote sensing imagery. It helps to visually represent and differentiate features or phenomena on a map based on their attributes or values.
There are several methods of data classification, including:

The choice of classification method depends on the nature of the data, the research question or objective, and the desired visualization or analysis outcomes. The classification method can significantly influence the interpretation and understanding of the data, so it is important to select an appropriate method that best represents the underlying patterns or characteristics in the dataset.
Data classification is an essential step in data analysis, as it enables the visualization and exploration of data patterns, trends, and distributions. It supports the identification of spatial relationships, the comparison of different areas or groups, and the communication of information in a more accessible and meaningful manner.
In GIS, expressions refer to a set of rules or formulas that are used to perform calculations, evaluations, or manipulations on geographic data. They allow users to create customized calculations, queries, or transformations based on specific criteria or conditions.
Expressions in GIS are typically written using a combination of functions, operators, and variables that operate on attribute data associated with spatial features or on the spatial properties of the features themselves. They can be used in various contexts, including data analysis, data visualization, labeling, symbology, and data manipulation.
These are some common examples of how expressions are used in GIS:
-
Attribute Calculations: Expressions can be used to calculate new attribute values based on mathematical operations, conditional statements, or combinations of existing attribute values. For instance, an expression can calculate population density by dividing the population attribute by the area attribute of each feature.
-
Spatial Queries: Expressions can be used to query and filter spatial data based on specific criteria. For example, an expression can select all features within a certain distance of a particular point or within a specific land use category.
-
Data Manipulation: Expressions can be used to manipulate and transform data. They can convert data types, concatenate strings, extract substrings, perform spatial transformations, or conduct spatial analyses.
For this exercise, we will be cleaning up the data by selecting the entries we want, calculating proportions, and reclassifying the data to quantiles using expressions. One of the expressions you will be using is as follows:
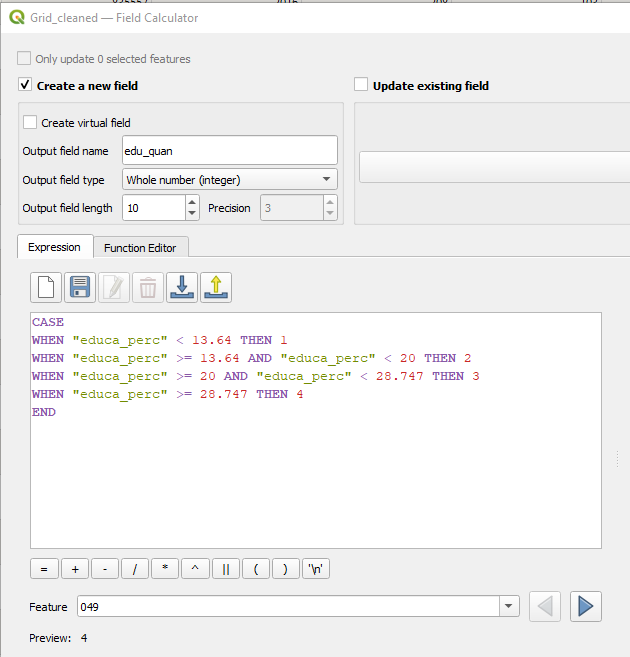
What do you think is the purpose of this expression?
Time to get your hands dirty! Move on to the 3rd exercise to apply this new knowledge
Footnotes
-
https://www.theguardian.com/cities/gallery/2016/jun/23/south-africa-divided-cities-apartheid-photographed-drone ↩
-
Hynynen, K. (2020). Raportti Tampereen kaupunkiseudun asuinalueiden eriytymiskehityksestä ja toimenpidesuositukset eriytymiskehityksen hillintään ja ennaltaehkäisyyn [Report of segregation of residential areas in the Tampere City Region and action proposals for the mitigation and prevention of segregation]. Tampere City Region. ↩