You signed in with another tab or window. Reload to refresh your session.You signed out in another tab or window. Reload to refresh your session.You switched accounts on another tab or window. Reload to refresh your session.Dismiss alert
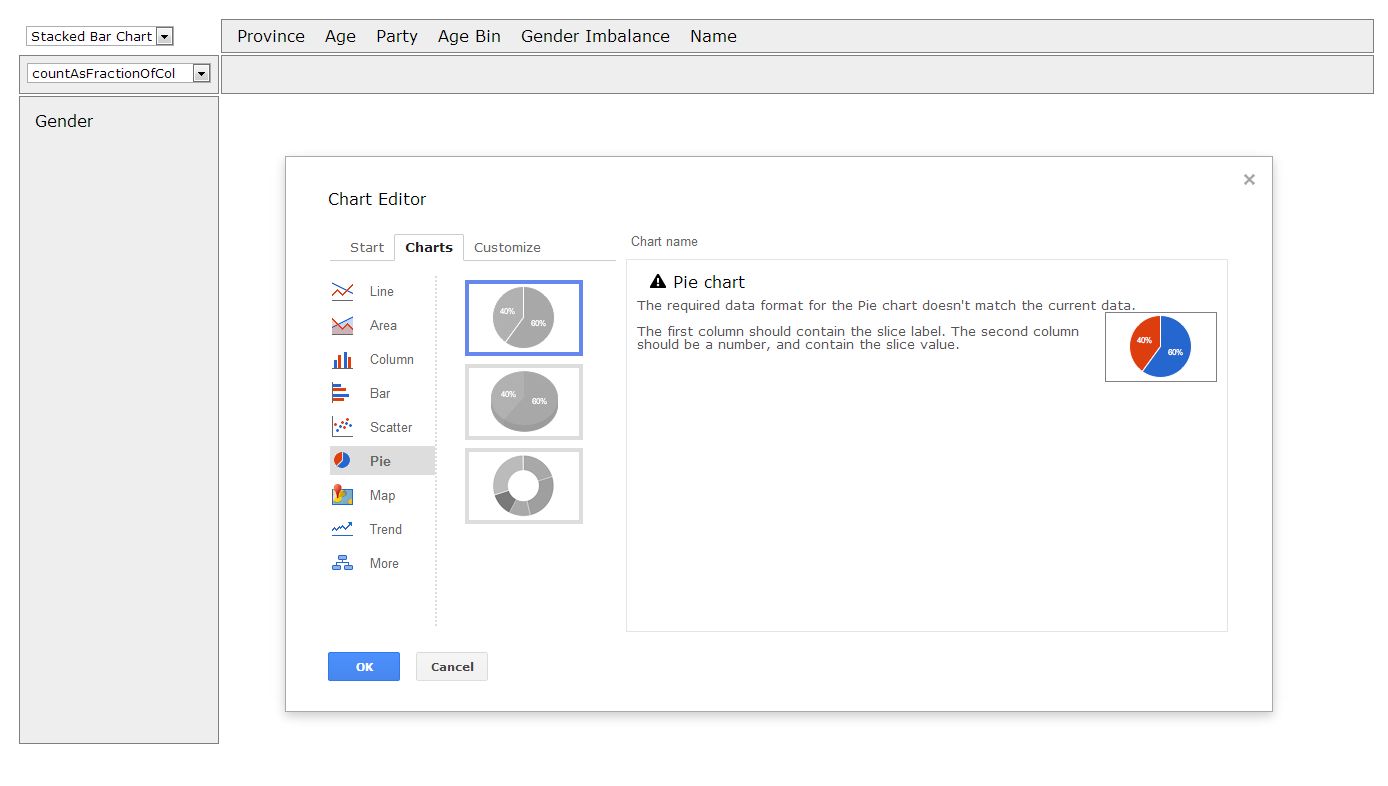
i can't seem to get the Gchart pie chart to work. When I try to chose, via GChart, the pie chart, it says 'the required data format for the Pie chart doesn't match the current data'. but I think I have aligned my data correctly because a stacked bar works fine and thus so should the pie. any ideas?
The text was updated successfully, but these errors were encountered:
You would have to put Gender in the column area rather than the row area for this to work. Note that Google Charts behaves very weirdly (i.e. gives incorrect numbers!) when you give it tabular data (i.e. attributes in both the column and row area) and try to display a pie chart. This is why I haven't made a pie-chart option in the dropdown. Ideally one would want multiple pie-charts to appear but this is not possible with Google Charts.
i can't seem to get the Gchart pie chart to work. When I try to chose, via GChart, the pie chart, it says 'the required data format for the Pie chart doesn't match the current data'. but I think I have aligned my data correctly because a stacked bar works fine and thus so should the pie. any ideas?

The text was updated successfully, but these errors were encountered: