Power of matrices, robustness of tables.
Frames is a package that introduces a new kind of data type for Matlab, the DataFrame. Demo: html/framesDemo.html
This data type (or class) helps when working with data matrices that are referenced by column and row identifiers (e.g. time series which have variable and observation names).
Matlab currently provide matrices and tables, but they do not work well together:
- Matlab native matrices are not aware of row and column names; when data represents observations of variables, it is always tricky to make sure the data is not misaligned (i.e. how to make sure that the ith row in matrices A and B represents the same observation).
- Matlab (time)tables have row and column names, but do not provide simple operations like addition (
table1+table2is not possible).
DataFrame aims at being both a matrix and a table, allowing intuitive operations on and between Frames, while applying sanity checks on rows and columns.
For example, frame1+frame2 is possible, and will align the rows or columns if required.
There are many more operations and tools to discover in the package.
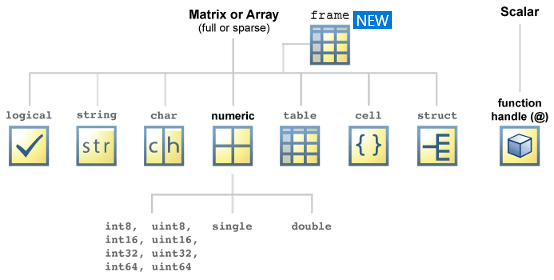
Below are the fundamental data types provided by Matlab together with the new Frame.
We provide two types of Frames: DataFrame and TimeFrame.
The distinction between the two is similar to that between Matlab native table and timetable; basically, the properties and methods are the same, but there are a few additional tools to handle time series in TimeFrame.
The package is compatible with Matlab R2021a and later versions. No other toolbox is required.
Use a frame when:
- your data has a homogeneous type (e.g. a matrix of doubles, of strings, of cellstr, etc.)
- you want to use matrix operations in a robust way (plus, times, mtimes, etc.)
- your data contains missing values, and you want to handle them directly (cf. dropMissing, ffill, resample) or you want your calculations not to be messed up by them (cumprod, sum, relChange, etc. ignore NaNs, but keep them in the result where they appeared, instead of replacing them by zero or applying a forward fill like Matlab does)
- you care about simple code, the fewer lines the better (e.g. dataFrame.log().plot() plots the logarithm of your dataFrame with a minimum of code)
- you need the rows (or columns) to have properties forcing it to be all the time sorted, or unique, or on the contrary allow it to have duplicate values. Tables only allow unique values (except for the rows of timetables which can contain duplicates).
- you want to use a specific method in frames (e.g. you work with time series and want to access the rolling and ewm computations)
- you want to work with multi-dimensional indices, including implicit dimension expansion, aggregation over dimensions and conversion from and to multi-dimensional matrices
Use a table when:
- your data is heterogeneous (i.e. variables have mixed types) and needs to stay that way (e.g. for SQL-like operations of joining and grouping)
- your variables can contain a matrix themselves, and not only a column vector
- you want to use a specific method or property in tables (note: most table methods are found in frames; plus, dataFrame.t returns a table type of the frame)
A demo is available in html/framesDemo.html and can be also found in the live script format framesDemo.mlx. An example of the multi-dimensional index functionality can be found in html/framesMultiDemo.html.
The documentation is available using Matlab's command
doc frames.DataFrame
doc frames.TimeFrameBenjamin Gaudin
Merijn Reijnders
Please send questions, feedback, suggestions, bug reports to [email protected] or open an issue on the github project.
Copyright 2021-2022 Benjamin Gaudin
Frames is free software made available under the MIT License. For details see the LICENSE file.

