Skip to content
New issue

Have a question about this project? Sign up for a free GitHub account to open an issue and contact its maintainers and the community.

By clicking “Sign up for GitHub”, you agree to our terms of service and privacy statement. We’ll occasionally send you account related emails.

Already on GitHub? Sign in to your account

Area chart is not refreshed when chart data is updated #15189

Closed
luckyrass opened this issue Sep 23, 2020 · 0 comments
Closed

Area chart is not refreshed when chart data is updated #15189

luckyrass opened this issue Sep 23, 2020 · 0 comments
Assignees
Labels
Fluent UI react (v8) Issues about @fluentui/react (v8) Needs: Investigation The Shield Dev should investigate this issue and propose a fix Package: charting

Comments

@luckyrass
Copy link
Contributor

Environment Information

  • Package version(s): (4.2.0)
  • Browser and OS versions: ()

Please provide a reproduction of the bug in a codepen:

Area chart is not refreshed when chart data is updated

Code to repro it

import * as React from 'react';
import { AreaChart } from '@uifabric/charting';
import { ILineChartProps } from '@uifabric/charting';
import { DefaultPalette } from 'office-ui-fabric-react/lib/Styling';

interface IAreaChartBasicState {
  width: number;
  height: number;
  chartData: any;
}

const chart1Points = [
  {
    x: 20,
    y: 7000,
    xAxisCalloutData: '2018/01/01',
    yAxisCalloutData: '10%',
  },
  {
    x: 25,
    y: 9000,
    xAxisCalloutData: '2018/01/15',
    yAxisCalloutData: '18%',
  },
  {
    x: 30,
    y: 13000,
    xAxisCalloutData: '2018/01/28',
    yAxisCalloutData: '24%',
  },
  {
    x: 35,
    y: 15000,
    xAxisCalloutData: '2018/02/01',
    yAxisCalloutData: '25%',
  },
  {
    x: 40,
    y: 11000,
    xAxisCalloutData: '2018/03/01',
    yAxisCalloutData: '15%',
  },
  {
    x: 45,
    y: 8760,
    xAxisCalloutData: '2018/03/15',
    yAxisCalloutData: '30%',
  },
  {
    x: 50,
    y: 3500,
    xAxisCalloutData: '2018/03/28',
    yAxisCalloutData: '18%',
  },
  {
    x: 55,
    y: 20000,
    xAxisCalloutData: '2018/04/04',
    yAxisCalloutData: '32%',
  },
  {
    x: 60,
    y: 17000,
    xAxisCalloutData: '2018/04/15',
    yAxisCalloutData: '29%',
  },
  {
    x: 65,
    y: 1000,
    xAxisCalloutData: '2018/05/05',
    yAxisCalloutData: '43%',
  },
  {
    x: 70,
    y: 12000,
    xAxisCalloutData: '2018/06/01',
    yAxisCalloutData: '45%',
  },
  {
    x: 75,
    y: 6876,
    xAxisCalloutData: '2018/01/15',
    yAxisCalloutData: '18%',
  },
  {
    x: 80,
    y: 12000,
    xAxisCalloutData: '2018/04/30',
    yAxisCalloutData: '55%',
  },
  {
    x: 85,
    y: 7000,
    xAxisCalloutData: '2018/05/04',
    yAxisCalloutData: '12%',
  },
  {
    x: 90,
    y: 10000,
    xAxisCalloutData: '2018/06/01',
    yAxisCalloutData: '45%',
  },
];

const chart2Points = [
  {
    x: 50,
    y: 3500,
    xAxisCalloutData: '2018/03/28',
    yAxisCalloutData: '18%',
  },
  {
    x: 55,
    y: 20000,
    xAxisCalloutData: '2018/04/04',
    yAxisCalloutData: '32%',
  },
  {
    x: 60,
    y: 17000,
    xAxisCalloutData: '2018/04/15',
    yAxisCalloutData: '29%',
  },
  {
    x: 65,
    y: 1000,
    xAxisCalloutData: '2018/05/05',
    yAxisCalloutData: '43%',
  },
  {
    x: 70,
    y: 12000,
    xAxisCalloutData: '2018/06/01',
    yAxisCalloutData: '45%',
  },
  {
    x: 75,
    y: 6876,
    xAxisCalloutData: '2018/01/15',
    yAxisCalloutData: '18%',
  },
  {
    x: 80,
    y: 12000,
    xAxisCalloutData: '2018/04/30',
    yAxisCalloutData: '55%',
  },
  {
    x: 85,
    y: 7000,
    xAxisCalloutData: '2018/05/04',
    yAxisCalloutData: '12%',
  },
  {
    x: 90,
    y: 10000,
    xAxisCalloutData: '2018/06/01',
    yAxisCalloutData: '45%',
  },
];

const chartPoints = [
  {
    legend: 'legend1',
    data: chart2Points,
    color: DefaultPalette.accent,
  },
];

const chartPoints1 = [
  {
    legend: 'legend1',
    data: chart1Points,
    color: 'red',
  },
];

export class AreaChartBasicExample extends React.Component<{}, IAreaChartBasicState> {
  constructor(props: ILineChartProps) {
    super(props);
    this.state = {
      width: 700,
      height: 300,
      chartData: chartPoints,
    };
  }

  public render(): JSX.Element {
    return <div>{this._basicExample()}</div>;
  }

  private _onWidthChange = (e: React.ChangeEvent<HTMLInputElement>) => {
    this.setState({ width: parseInt(e.target.value, 10) });
  };
  private _onHeightChange = (e: React.ChangeEvent<HTMLInputElement>) => {
    console.log('height change');
    this.setState({ height: parseInt(e.target.value, 10) });
  };

  private _onDataChange = () => {
    console.log('data change');
    this.setState({ chartData: chartPoints1 });
  };

  private _basicExample(): JSX.Element {
    const chartData = {
      chartTtitle: 'Area chart basic example',
      lineChartData: this.state.chartData,
    };

    const rootStyle = { width: `${this.state.width}px`, height: `${this.state.height}px` };

    return (
      <>
        <label>change Width:</label>
        <input type="range" value={this.state.width} min={200} max={1000} onChange={this._onWidthChange} />
        <label>change Height:</label>
        <input type="range" value={this.state.height} min={200} max={1000} onChange={this._onHeightChange} />
        <div style={rootStyle}>
          <AreaChart
            height={this.state.height}
            width={this.state.width}
            data={chartData}
            showYAxisGridLines={true}
            yMinValue={100}
          />
        </div>
        <button
          onClick={() => {
            this._onDataChange();
          }}
        >
          Update data
        </button>
      </>
    );
  }
}

Actual behavior:

Click the "Update data" button. The chart data is not updated.
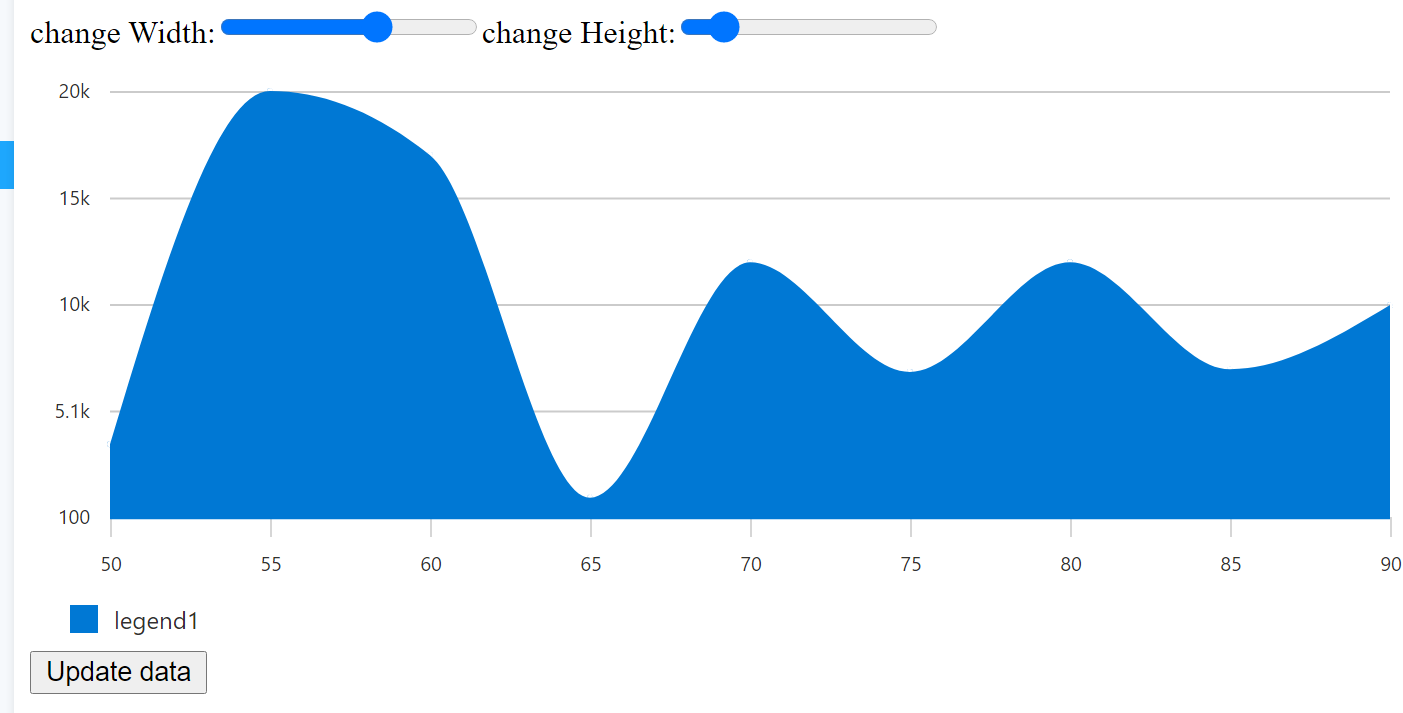
image

Expected behavior:

Click the "Update data" button. The chart is as below
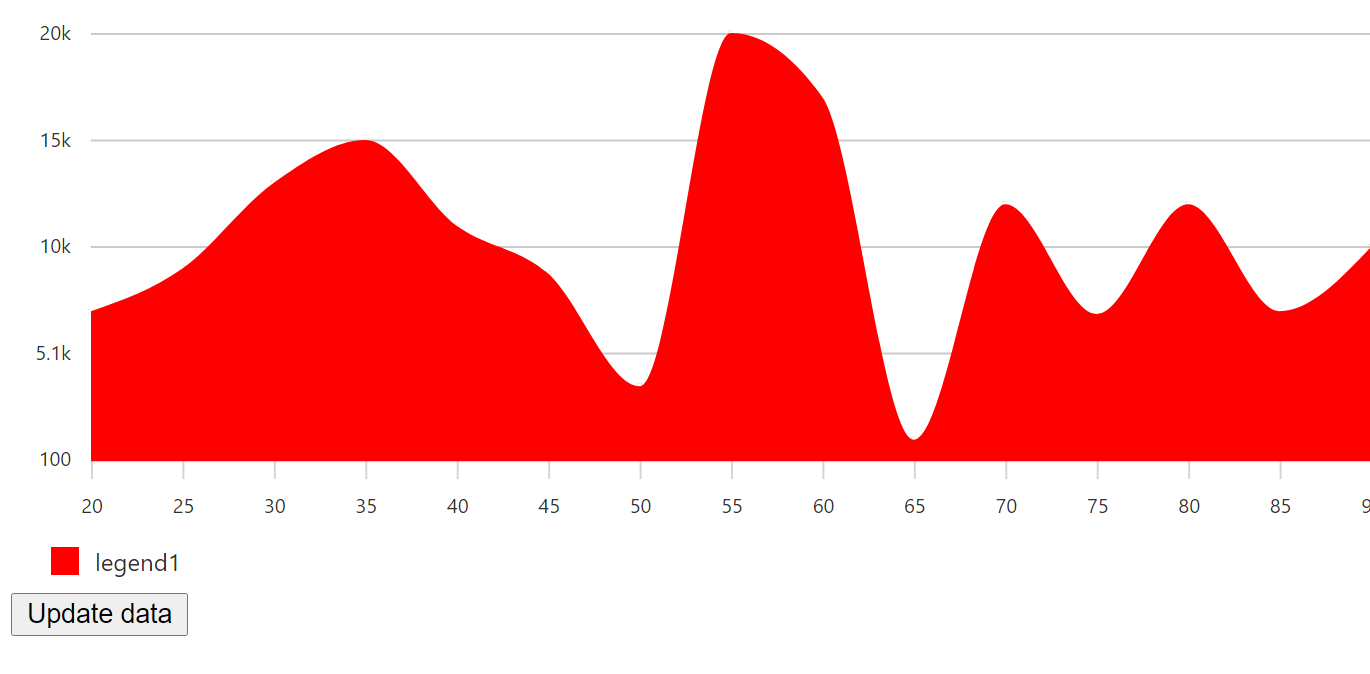
image

Priorities and help requested:

Are you willing to submit a PR to fix? (Yes, No)

Requested priority: (Blocking)

Products/sites affected: (if applicable)

Sign up for free to subscribe to this conversation on GitHub. Already have an account? Sign in.
Labels
Fluent UI react (v8) Issues about @fluentui/react (v8) Needs: Investigation The Shield Dev should investigate this issue and propose a fix Package: charting
Projects
None yet
Development

No branches or pull requests

5 participants