Please follow the instructions provided in the README to install gbintk.
Now we are all set for the demo.
Test data for the demo can be found in the tests/data/5G_metaSPAdes/ folder. Let's set the testing directory path to a variable as shown below so we don't have to type the path every time.
TESTDIR=tests/data/5G_metaSPAdes/Run the following command to bin the test dataset using MetaCoAG.
gbintk metacoag --assembler spades --graph $TESTDIR/assembly_graph_with_scaffolds.gfa --contigs $TESTDIR/contigs.fasta --paths $TESTDIR/contigs.paths --abundance $TESTDIR/coverm_mean_coverage.tsv --output $TESTDIRRun the following command to refine the binning results using GraphBin.
gbintk graphbin --assembler spades --graph $TESTDIR/assembly_graph_with_scaffolds.gfa --contigs $TESTDIR/contigs.fasta --paths $TESTDIR/contigs.paths --binned $TESTDIR/contig_to_bin.tsv --output $TESTDIRRun the following command to visualise the original binning result and the refined binning results on the assembly graph.
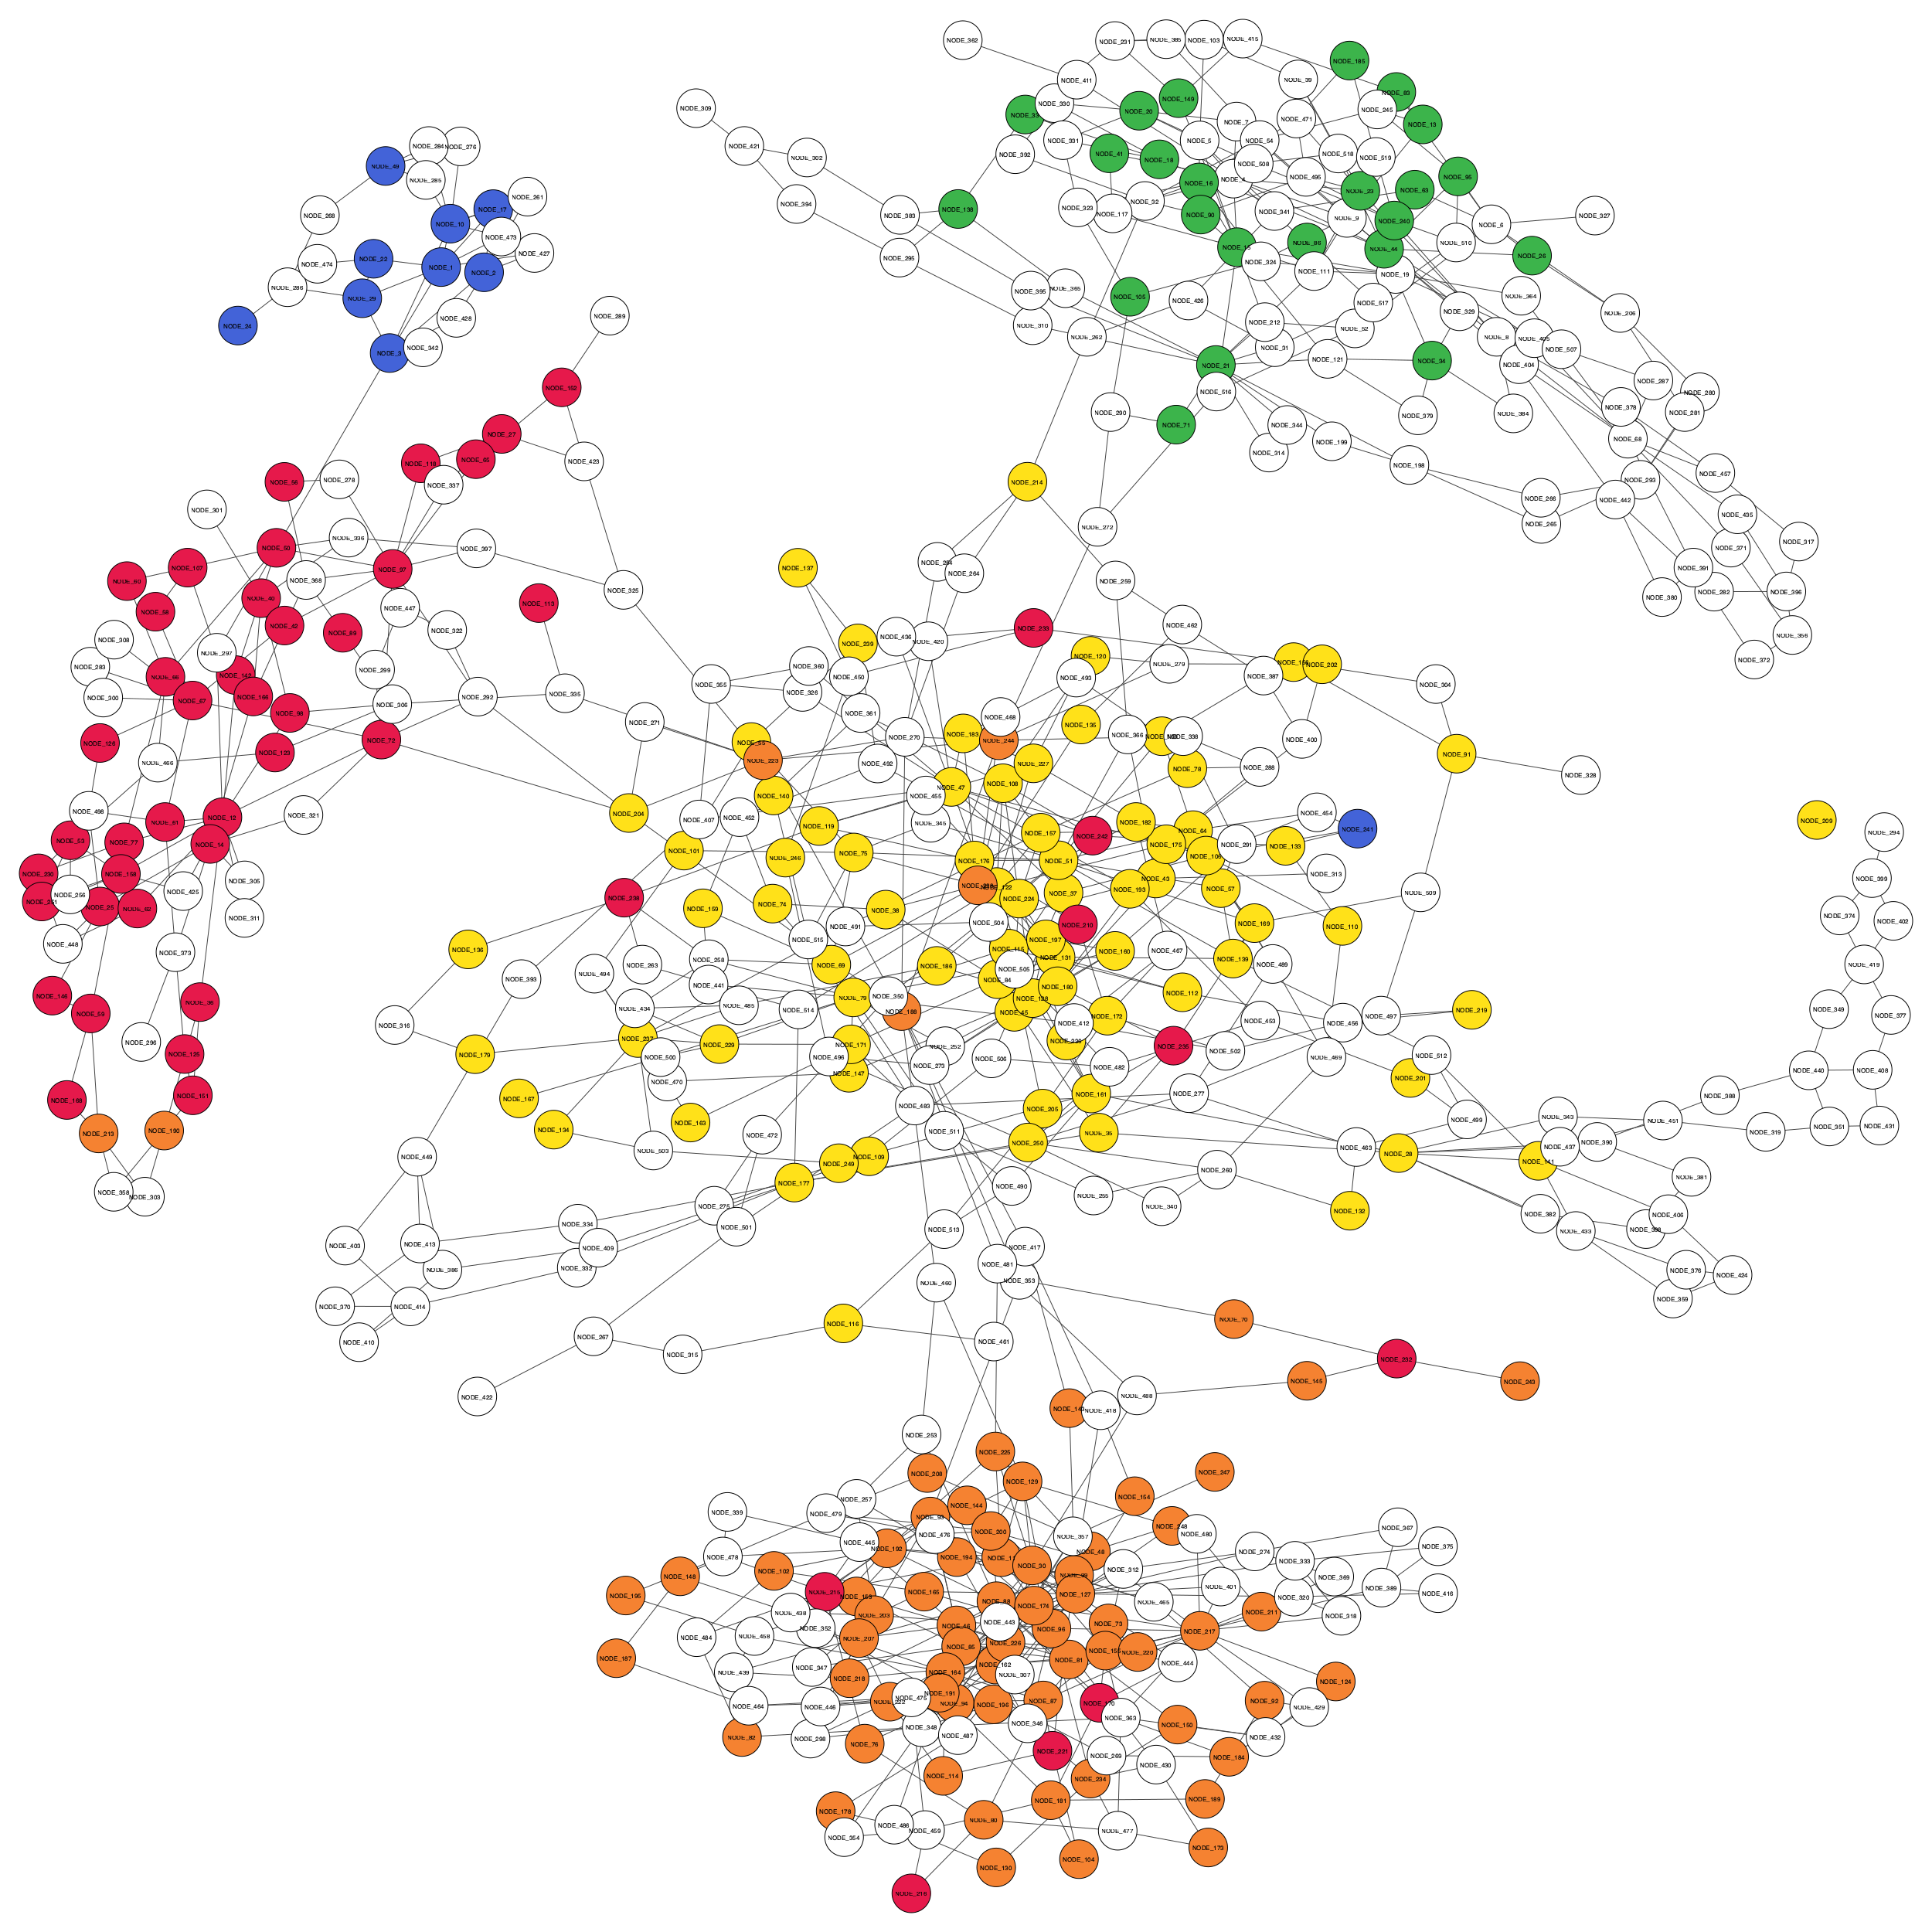
gbintk visualise --assembler spades --initial $TESTDIR/contig_to_bin.tsv --final $TESTDIR/graphbin_output.csv --graph $TESTDIR/assembly_graph_with_scaffolds.gfa --paths $TESTDIR/contigs.paths --output $TESTDIR --width 2500 --height 2500Below are some example visualisations generated.
Initial binning result
Refined binning result
Run the following command to evaluate the initial and final binning results.
gbintk evaluate --binned $TESTDIR/metacoag_res.csv --groundtruth $TESTDIR/ground_truth.csv --output $TESTDIR/The output in evaluation_results.txt will be as follows.
KxS Matrix:
--  --  -  --  --
 1   0  9   0   0
75   0  0   0   0
 0   0  0  23   0
 1  63  0   0   2
 6   4  0   0  22
--  --  -  --  --
Evaluation Results:
Precision = 93.20388349514563
Recall = 37.721021611001966
F1-score = 53.70629370629371
ARI = 84.17314460729499
gbintk evaluate --binned $TESTDIR/graphbin_res.csv --groundtruth $TESTDIR/ground_truth.csv --output $TESTDIR/The output in evaluation_results.txt will be as follows.
KxS Matrix:
--  ---  ---  --  ---
 0    0    0  70    0
18    0    0   0    0
 0    0    0   0  189
 0    0  117   0    0
 0  103    0   0    0
--  ---  ---  --  ---
Evaluation Results:
Precision = 100.0
Recall = 97.64243614931237
F1-score = 98.80715705765408
ARI = 100.0

