-
Notifications
You must be signed in to change notification settings - Fork 114
/
Copy pathindex.md
33 lines (24 loc) · 1.27 KB
/
index.md
1
2
3
4
5
6
7
8
9
10
11
12
13
14
15
16
17
18
19
20
21
22
23
24
25
26
27
28
29
30
31
32
33
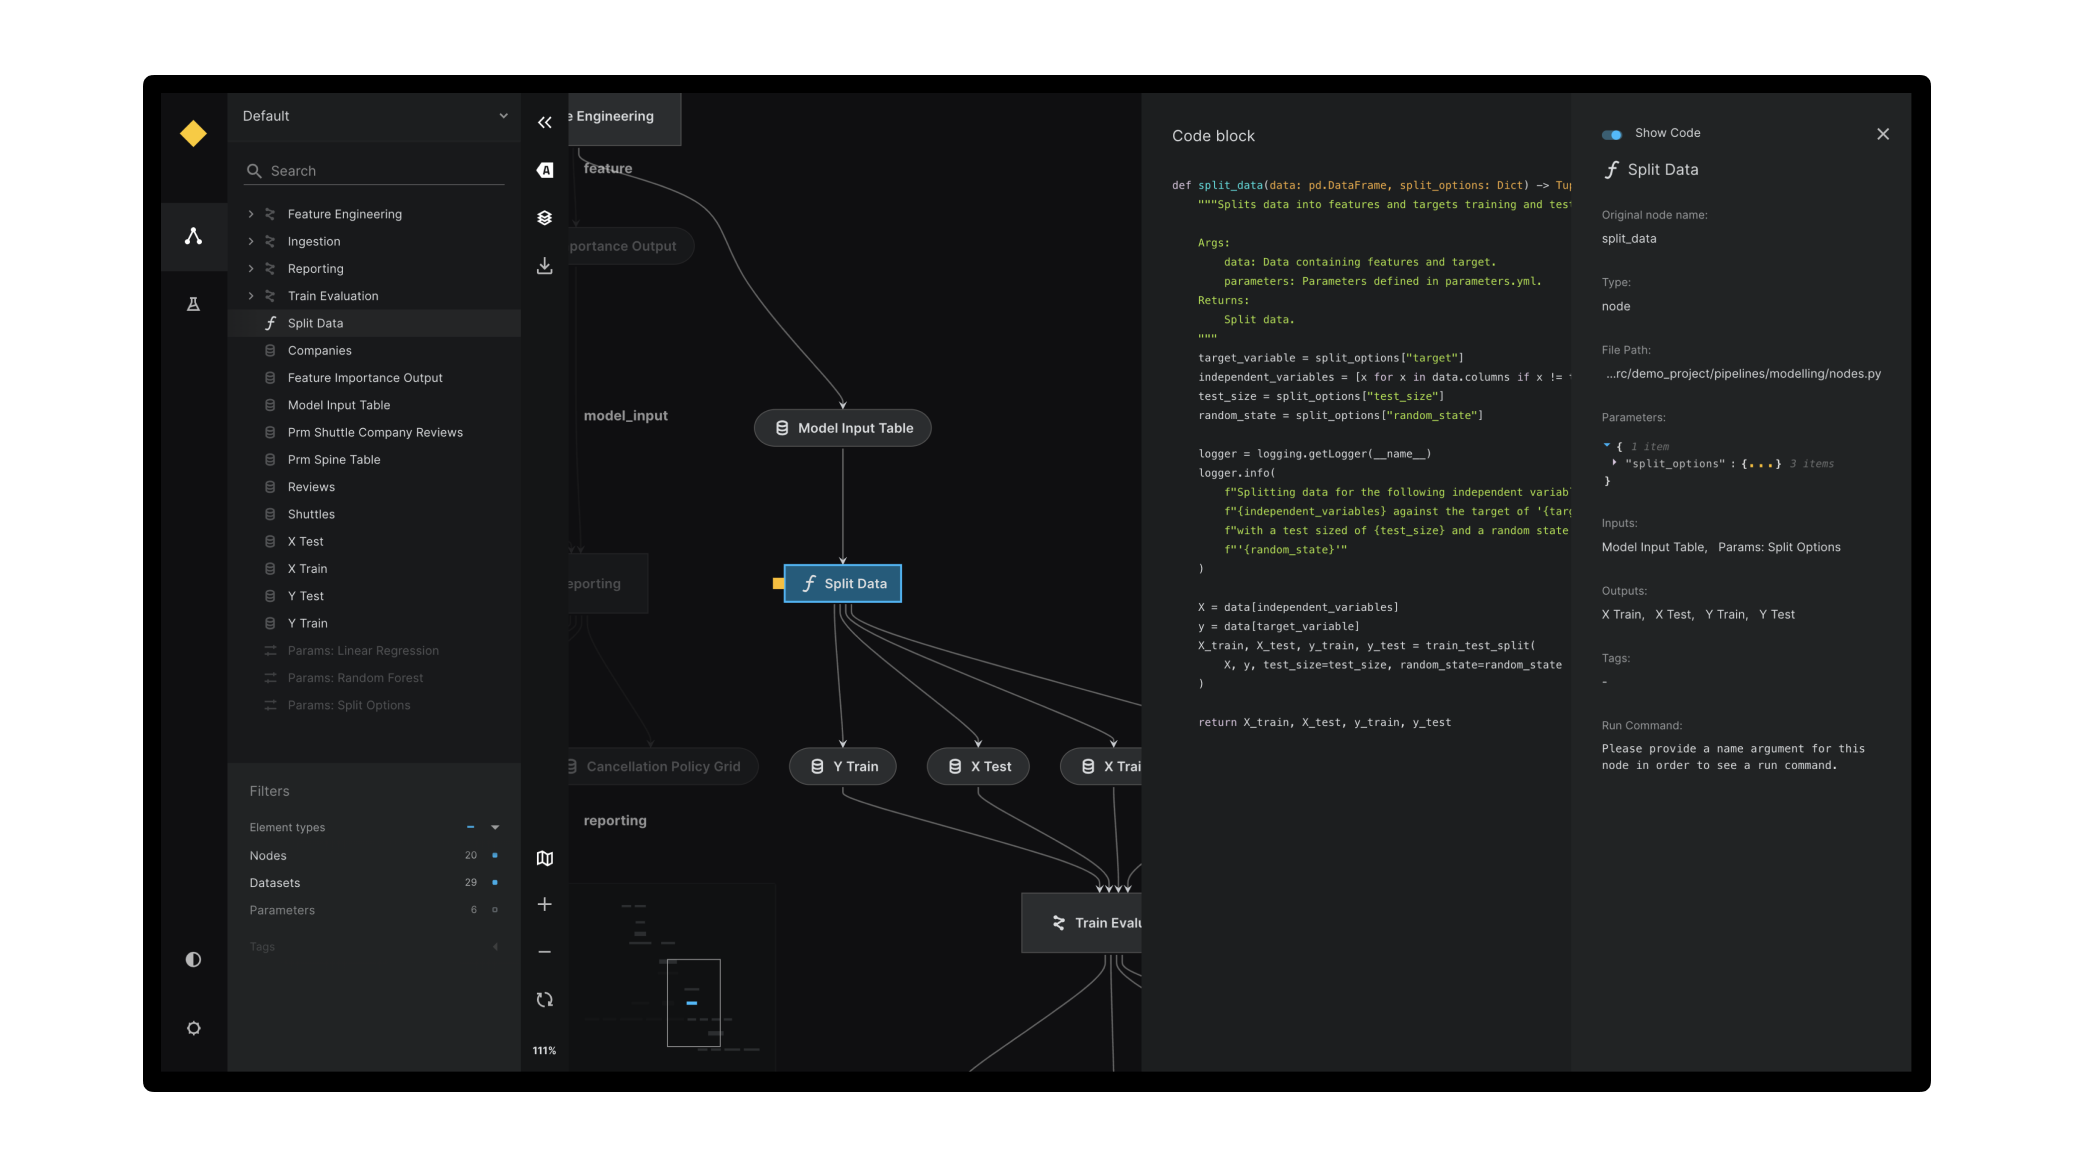
# Welcome to Kedro-Viz documentation!
<p align="center">
</p>
Kedro-Viz is an interactive development tool for visualising data science pipelines built with [Kedro](https://github.com/kedro-org/kedro). Kedro-Viz also enables users to view and compare different experiment runs within their Kedro project.
Kedro-Viz features include:
✨ Complete visualisation of a Kedro project and its pipelines.
☯ Support for light & dark themes out of the box.
🚀 Scalable to big pipelines with hundreds of nodes.
🔎 Highly interactive, filterable and searchable.
🔬 Focus mode for modular pipeline visualisation.
🎨 Rich metadata side panel to display parameters, plots, etc.
📊 Support for all types of [Plotly charts](https://plotly.com/javascript/).
♻️ Autoreload on code change.
🧪 Support for experiment tracking and comparing runs in a Kedro project.
Take a look at the <a href="https://demo.kedro.org/" target="_blank" rel="noopener noreferrer">live demo</a> for a preview of Kedro-Viz.
```{toctree}
:caption: Learn about Kedro-Viz
:maxdepth: 2
kedro-viz_visualisation
share_kedro_viz
preview_datasets
experiment_tracking
```