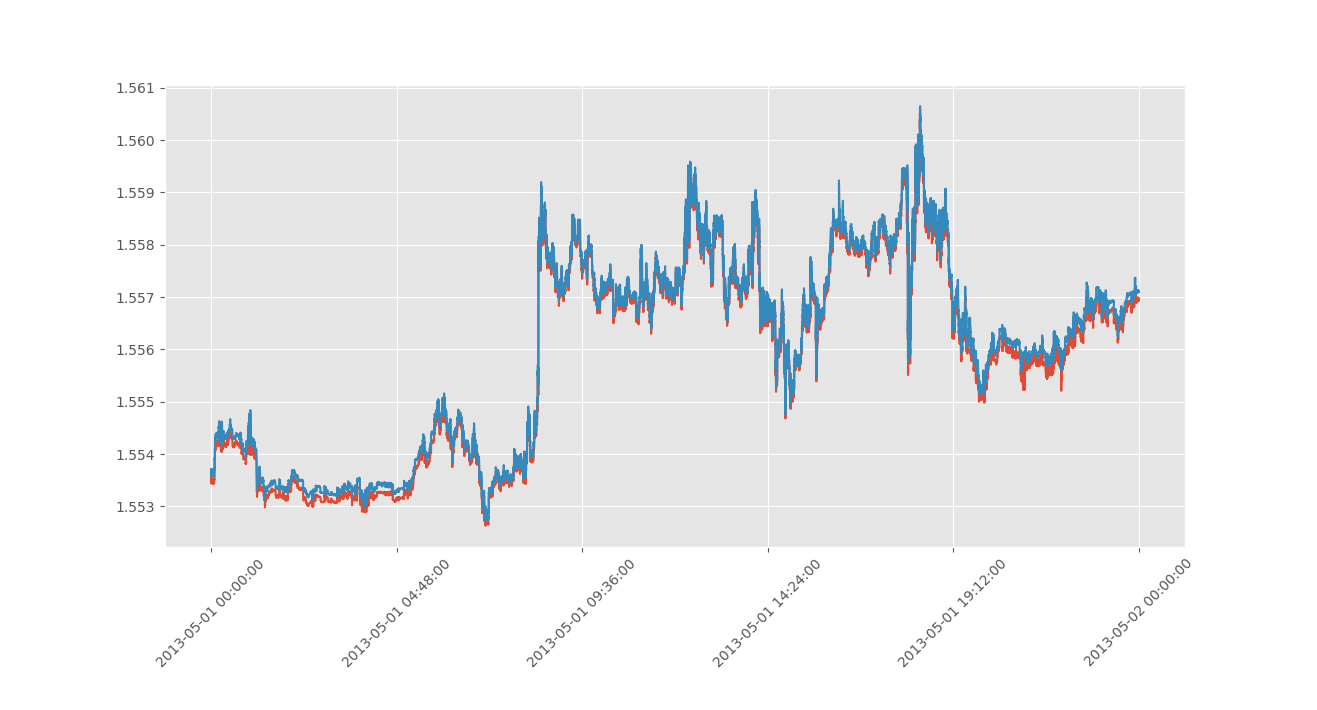
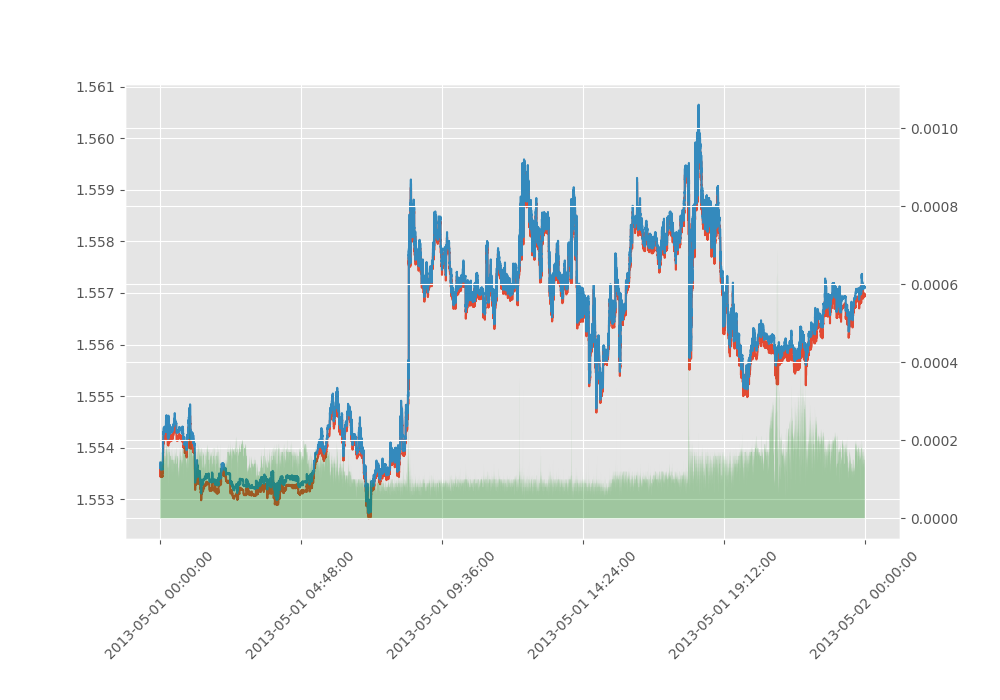
The first thing we need to do is go ahead and plot this data out to see what we're working with, and see what our goals are.
It's a good idea to get comfortable with visualizing data in Python.
import matplotlib
import matplotlib.pyplot as plt
import matplotlib.ticker as mticker
from matplotlib.dates import bytespdate2num
import numpy as np
from matplotlib import style
style.use("ggplot")

def graphRawFX():
    date,bid,ask = np.loadtxt('GBPUSD1d.txt', unpack=True,
                              delimiter=',',
                              converters={0:mdates.bytespdate2num('%Y%m%d%H%M%S')})
    fig = plt.figure(figsize=(10,7))
    ax1 = plt.subplot2grid((40,40), (0,0), rowspan=40, colspan=40)
    ax1.plot(date,bid)
    ax1.plot(date,ask)
    ax1.xaxis.set_major_formatter(mdates.DateFormatter('%Y-%m-%d %H:%M:%S'))
    for label in ax1.xaxis.get_ticklabels():
            label.set_rotation(45)
    plt.subplots_adjust(bottom=.23)
    plt.gca().get_yaxis().get_major_formatter().set_useOffset(False)
    plt.grid(True)
    plt.show()
graphRawFX()import matplotlib
import matplotlib.pyplot as plt
import matplotlib.ticker as mticker
from matplotlib.dates import bytespdate2num
import numpy as np
from matplotlib import style
style.use("ggplot")
def graphRawFX():
date,bid,ask = np.loadtxt('GBPUSD1d.txt', unpack=True,
delimiter=',',
converters={0:mdates.bytespdate2num('%Y%m%d%H%M%S')})
fig = plt.figure(figsize=(10,7))
ax1 = plt.subplot2grid((40,40), (0,0), rowspan=40, colspan=40)
ax1.plot(date,bid)
ax1.plot(date,ask)
ax1.xaxis.set_major_formatter(mdates.DateFormatter('%Y-%m-%d %H:%M:%S'))
plt.grid(True)
for label in ax1.xaxis.get_ticklabels():
label.set_rotation(45)
plt.subplots_adjust(bottom=.23)
plt.gca().get_yaxis().get_major_formatter().set_useOffset(False)
ax1_2 =ax1.twinx()
ax1_2.fill_between(date, 0, (ask-bid), facecolor='g',alpha=.3)
plt.subplots_adjust(bottom=.23)
plt.show()
graphRawFX()
