You signed in with another tab or window. Reload to refresh your session.You signed out in another tab or window. Reload to refresh your session.You switched accounts on another tab or window. Reload to refresh your session.Dismiss alert
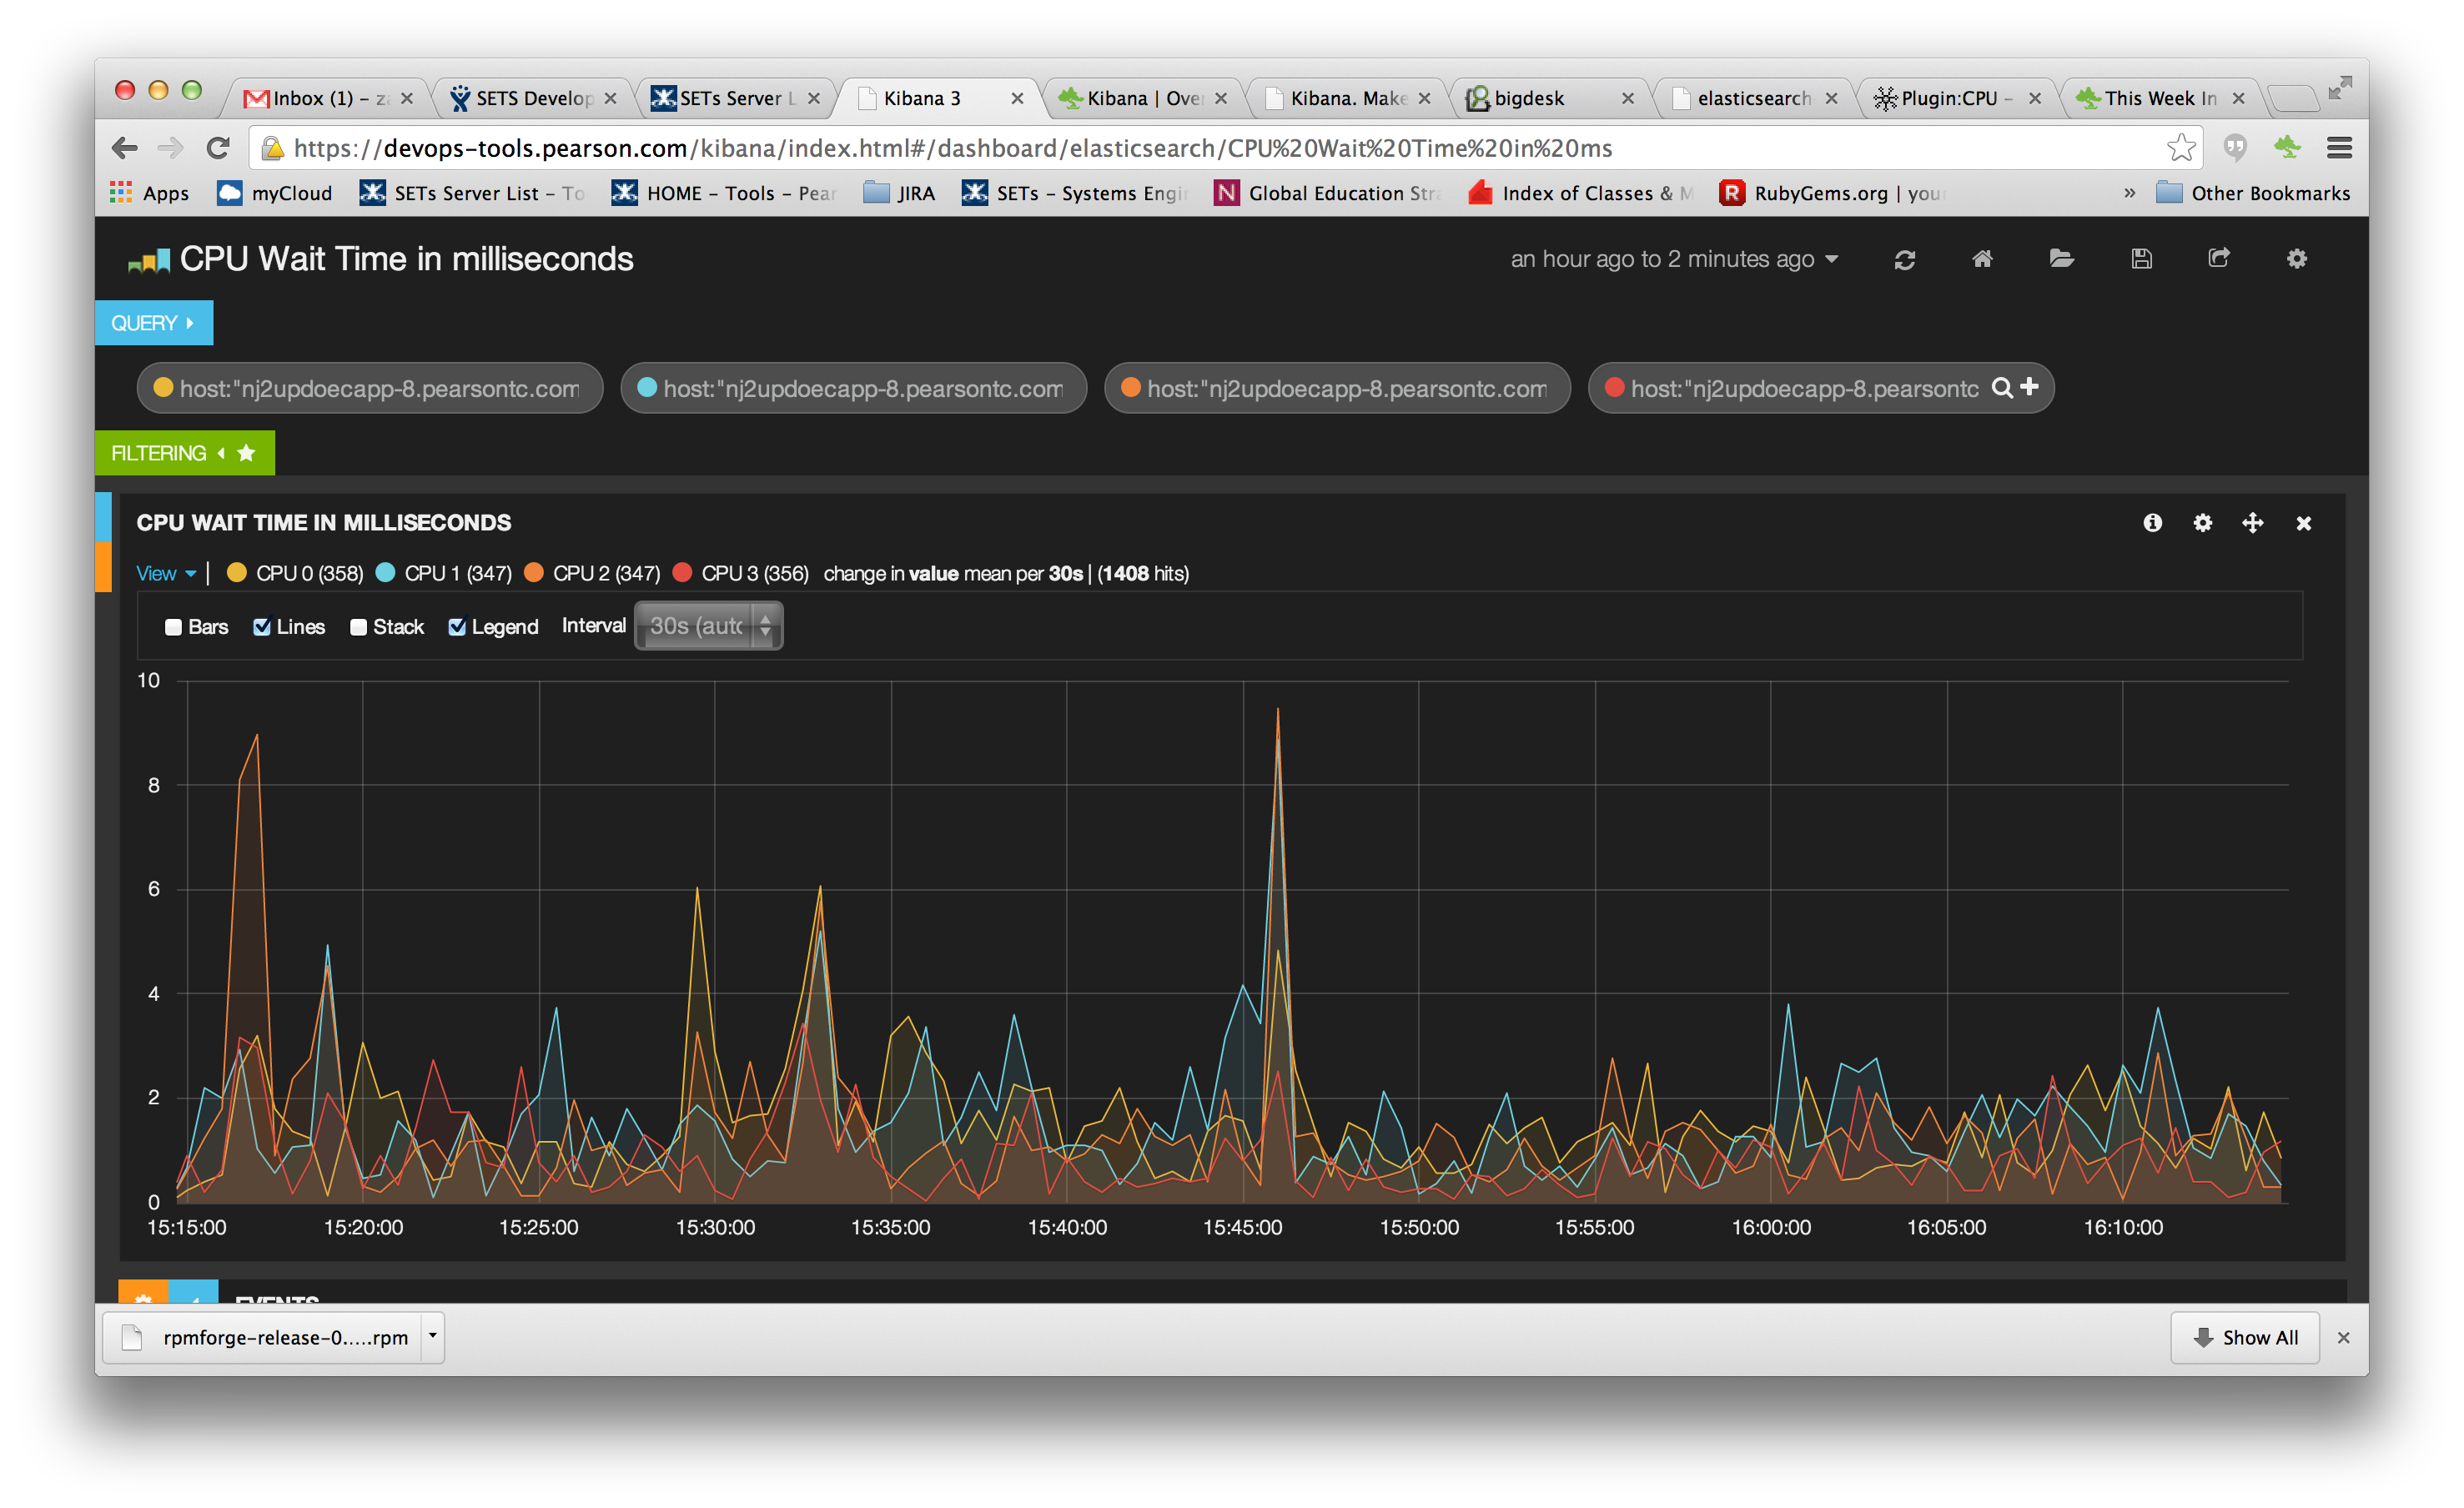
I am using the collectd input and attempting to create a dashboard for system cpu io wait. Some systems will have one cpu while others will have multiple, is there a way to dynamically build the graph depending on the "plugin_instance" value?
In the past I could have used the derived query feature, but that has been removed in Kibana 3 milestone pre-5.
Currently for a four cpu system I need four seperate queries like the following:
host:"host1" AND plugin_instance:0 AND collectd_type:"cpu" AND type_instance:"wait"
host:"host2" AND plugin_instance:0 AND collectd_type:"cpu" AND type_instance:"wait"
host:"host3" AND plugin_instance:0 AND collectd_type:"cpu" AND type_instance:"wait"
host:"host4" AND plugin_instance:0 AND collectd_type:"cpu" AND type_instance:"wait"
Thanks
The text was updated successfully, but these errors were encountered:
I am using the collectd input and attempting to create a dashboard for system cpu io wait. Some systems will have one cpu while others will have multiple, is there a way to dynamically build the graph depending on the "plugin_instance" value?
In the past I could have used the derived query feature, but that has been removed in Kibana 3 milestone pre-5.

Currently for a four cpu system I need four seperate queries like the following:
host:"host1" AND plugin_instance:0 AND collectd_type:"cpu" AND type_instance:"wait"
host:"host2" AND plugin_instance:0 AND collectd_type:"cpu" AND type_instance:"wait"
host:"host3" AND plugin_instance:0 AND collectd_type:"cpu" AND type_instance:"wait"
host:"host4" AND plugin_instance:0 AND collectd_type:"cpu" AND type_instance:"wait"
Thanks
The text was updated successfully, but these errors were encountered: