The newest documentation is now being maintained at debug-highcpu. This documentation is no longer being updated.
http://localhost:5000/api/diagscenario/highcpu/{milliseconds}
In this scenario, the endpoint will consume substantial amount of CPU for a duration specified by {milliseconds}. In order to diagnose this scenario, we need several key pieces of diagnostics data.
Before we dig into collecting diagnostics data to help us root cause this scenario, we need to convince ourselves that what we are actually seeing is a high CPU condition. On Windows we could use the myriad of .NET performance counters, but what about on Linux? It turns out .net core has been instrumented to expose metrics from the runtime and we can use the dotnet-counters tool to get at this information (please see 'Installing the diagnostics tools' section).
Lets run the webapi (dotnet run) and before hitting the above URL that will cause the high CPU condition, lets check our CPU counters:
dotnet-counters monitor --refresh-interval 1 -p 22884
22884 is the process identifier which can be found using dotnet-trace ps. The refresh-interval is the number of seconds before refreshes.
The output should be similar to the below:
Here we can see that right after startup, the CPU is not being consumed at all (0%).
Now, let's hit the URL (http://localhost:5000/api/diagscenario/highcpu/60000)
Re-run the dotnet-counters command. We should see an increase in CPU usage as shown below:
Throughout the execution of that request, CPU hovers at around 30%.
Note that this shows all the counters. If you want to specify individual counters please use the System.Private[counter1, counter2,...] syntax. For example, to display just the gc-heap-counter, use:
dotnet-counters monitor System.Runtime[cpu-usage] -p 22884 --refresh-interval 1
At this point, we can safely say that CPU is running a little hotter than we expect. The next step is now to run a collection tool that can help us collect the right data for the CPU analysis.
Commonly when analyzing slow request (such as due to high CPU), we need a diagnostics tool that can give us insight into what our code is doing at frequent intervals. A very common diagnostics data source is a profiler. There are a few different options in terms of profilers and depending on which platform you plan on analyzing the trace data on.
In order to generate profiler traces of a .net core application, we can use the dotnet-trace tool (please see 'Installing the diagnostics tools' section). Using the previous webapi, hit the URL (http://localhost:5000/api/diagscenario/highcpu/60000) again and while its running within the 1 minute request, run the following:
dotnet-trace collect -p 2266 --providers Microsoft-DotNETCore-SampleProfiler
2266 is the process identifier which can be found using dotnet-trace ps. Let dotnet-trace run for about 20-30 seconds and then hit enter to exit the collection. The result is a nettrace file located in the same folder. nettrace files are a great way to use existing analysis tools on Windows (such as PerfView) to diagnose performance problems.
Alternatively, you can get the perf and LTTng trace data in nettrace format by using the perfcollect tool (please see Installing the tools section). Once installed, run the following command:
sudo ./perfcollect collect sampleTrace
Reproduce the problem and when done, hit CTRL-C to exit the perfcollect tool. You will see a sampleTrace.trace.zip file that you can view using Perfview on a Windows machine.
If you are more familiar with existing performance tools on Linux, .net core is also instrumented to allow you to make use of those tools. Here, we will illustrate how you can use the 'perf' tool to generate traces that can be used on Linux to diagnose performance problems. Exit the previous instance of the webapi and set the following in the terminal:
export DOTNET_PerfMapEnabled=1
Next, re-launch the webapi. This step is required to get more legible frames in the traces.
In the same terminal, run the webapi again, hit the URL (http://localhost:5000/api/diagscenario/highcpu/60000) again and while its running within the 1 minute request, run the following:
sudo perf record -p 2266 -g
This will start the perf collection process. Let it run for about 20-30 seconds and then hit CTRL-C to exit the collection process. The output should tell you how many MBs of perf data was written.
When it comes to analyzing the profiler trace generated in the previous step, you have two options depending on if you generated a nettrace file or used the native perf command in Linux.
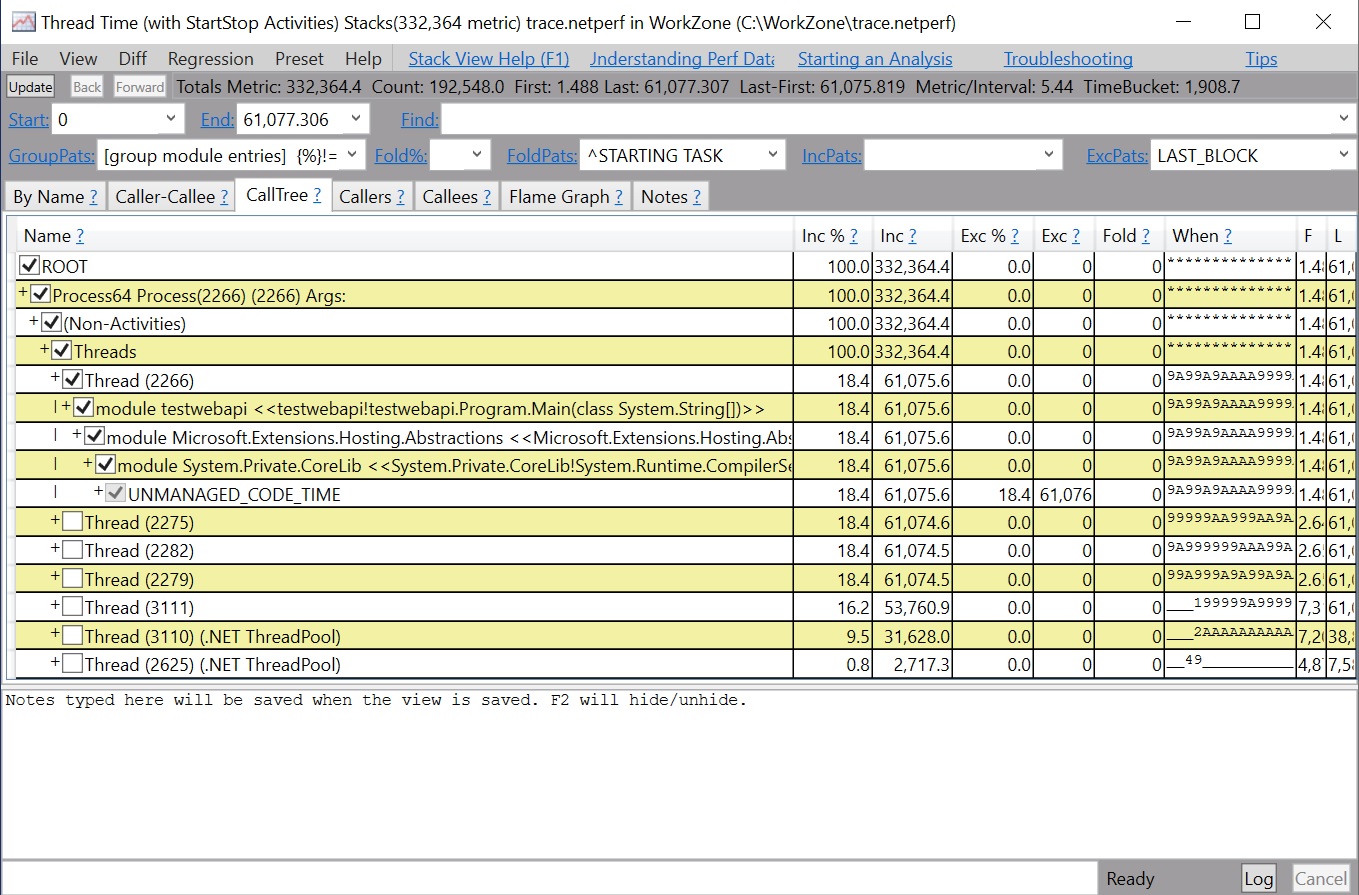
Starting with the nettrace file, you need to transfer the nettrace file to a Windows machine and use PerfView to analyze the trace as shown below.
If you generated the traces using the Linux perf command, you can use the same perf command to see the output of the trace.
sudo perf report -f
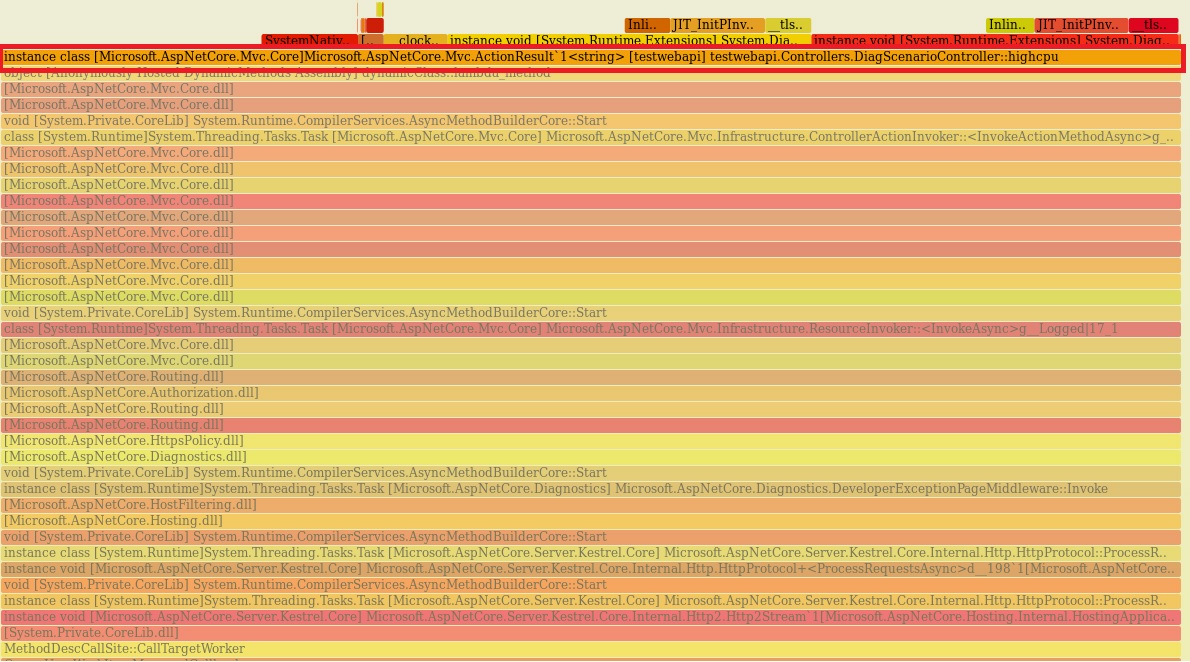
Alternatively, you can also generate a flamegraph by using the following commands:
git clone --depth=1 https://github.com/BrendanGregg/FlameGraph
sudo perf script | FlameGraph/stackcollapse-perf.pl | FlameGraph/flamegraph.pl > flamegraph.svg
This will generate a flamegraph.svg that you can view in the browser to investigate the performance problem:


