-
-
Notifications
You must be signed in to change notification settings - Fork 6k
New issue
Have a question about this project? Sign up for a free GitHub account to open an issue and contact its maintainers and the community.
By clicking “Sign up for GitHub”, you agree to our terms of service and privacy statement. We’ll occasionally send you account related emails.
Already on GitHub? Sign in to your account
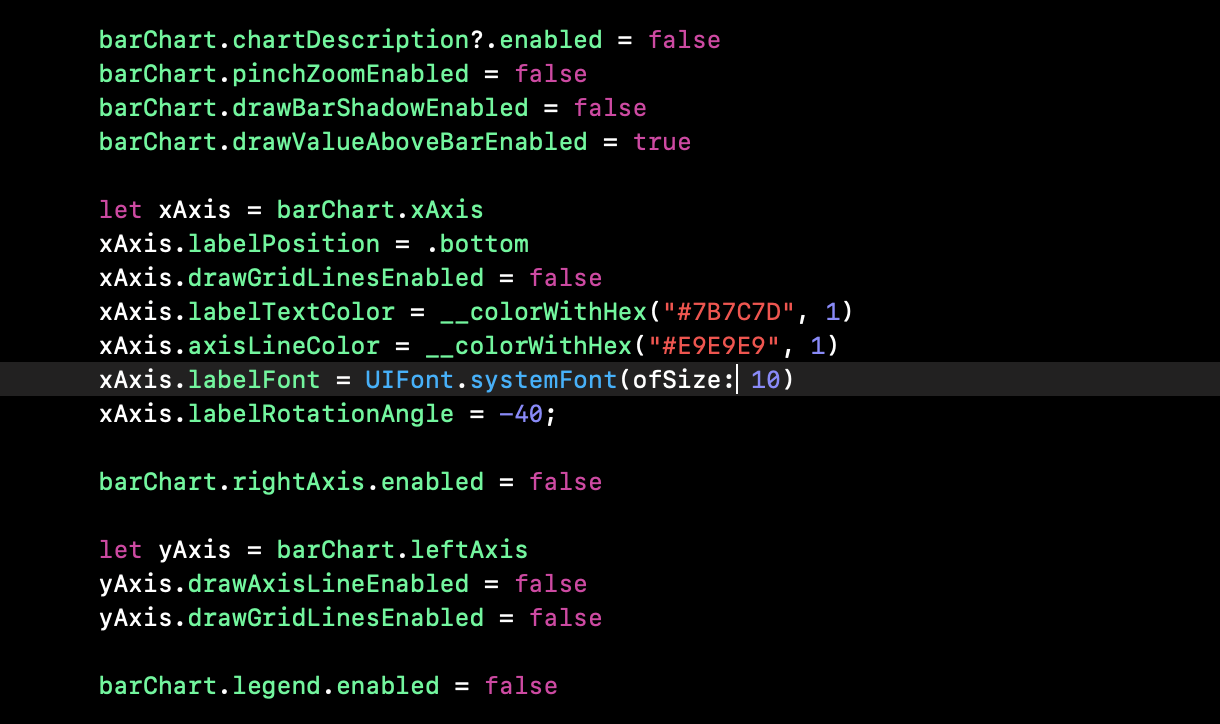
为什么x轴和柱子之间有空间呢? #4307
Comments
|
|
这个问题怎么解决的? |
贴下你的代码 |
|
//
import Foundation
import UIKit
import RxSwift
import RxCocoa
import Charts
class MonitorSeachDetailChartView: UIView {
var chartModelData:MonitorSeachDetailModelData?
lazy var chartView: CombinedChartView = {
let chartView = CombinedChartView()
chartView.drawBarShadowEnabled = false
chartView.highlightFullBarEnabled = true
chartView.drawOrder = [DrawOrder.bar.rawValue,DrawOrder.line.rawValue]
chartView.highlightPerTapEnabled = true
chartView.drawGridBackgroundEnabled = true
chartView.gridBackgroundColor = .init(hex: "#FBFBFD")
chartView.scaleYEnabled = false
chartView.doubleTapToZoomEnabled = false
chartView.noDataText = ""
let l = chartView.legend
l.enabled = true
l.wordWrapEnabled = true
l.horizontalAlignment = .left
l.verticalAlignment = .top
l.orientation = .horizontal
l.drawInside = false
l.form = .circle
l.xEntrySpace = 10
l.xOffset = 0
l.formSize = 10
l.font = UIFont.systemFont(ofSize: 10)
let leftAxis = chartView.leftAxis
leftAxis.labelCount = 4
leftAxis.drawGridLinesEnabled = true
leftAxis.gridColor = UIColor.lineColor
leftAxis.gridLineWidth = 0.5
leftAxis.drawZeroLineEnabled = false
leftAxis.valueFormatter = LargeValueFormatter()
leftAxis.axisLineColor = .clear
let rightAxis = chartView.rightAxis
rightAxis.labelCount = 4
rightAxis.drawGridLinesEnabled = false
rightAxis.gridColor = UIColor.lineColor
rightAxis.gridLineWidth = 0.5
rightAxis.axisLineColor = .clear
rightAxis.valueFormatter = LargeValueFormatter()
rightAxis.drawLabelsEnabled = false
let xAxis = chartView.xAxis
xAxis.labelPosition = .bottom
xAxis.granularity = 1
xAxis.centerAxisLabelsEnabled = true
xAxis.drawGridLinesEnabled = false
xAxis.granularityEnabled = true
xAxis.granularity = 1.0
return chartView
}()
func setChartGranularity(granularity:Double,granularityEnabled:Bool) {
chartView.xAxis.granularityEnabled = granularityEnabled
chartView.xAxis.granularity = granularity
}
override init(frame: CGRect) {
super.init(frame: frame)
self.addSubview(chartView)
chartView.snp.makeConstraints { make in
make.top.equalToSuperview().offset(0)
make.left.right.bottom.equalToSuperview()
}
}
required init?(coder: NSCoder) {
fatalError("init(coder:) has not been implemented")
}
func bind(to model:MonitorSeachDetailModelData) {
self.chartModelData = model
let data = CombinedChartData()
var setArr = [LineChartDataSet]()
var barSetArr = [BarChartDataSet]()
for (i,subModel) in model.MonitorSeachDetailModelList.enumerated() {
if subModel.currentType == "Line" {
let linedataSet = generateLineData(model: subModel,count: i)
setArr.append(linedataSet)
let lineChartData = LineChartData(dataSets: setArr)
data.lineData = lineChartData
}else{
let bardataSet = generateBarData(model: subModel,count: i)
barSetArr.append(bardataSet)
let barChartData = BarChartData(dataSets: barSetArr)
// (0.4 + 0.05) * 2 (data set count) + 0.1 = 1
let groupSpace = 0.06
let barSpace = 0.02 // x2 dataset
var width:Double = 0.85
let count :Int = model.barCount
if count > 1 {
width = (1 - 0.06)/Double(count) - 0.02
barChartData.barWidth = width
barChartData.groupBars(fromX: 0, groupSpace: groupSpace, barSpace: barSpace)
}
data.barData = barChartData
}
}
chartView.xAxis.valueFormatter = IndexAxisValueFormatter(values: model.totalDateArr)
chartView.rightAxis.valueFormatter = LargeValueFormatter()
chartView.leftAxis.valueFormatter = LargeValueFormatter()
if model.MonitorSeachDetailModelList.count > 1 {
chartView.rightAxis.drawLabelsEnabled = true
}else{
chartView.rightAxis.drawLabelsEnabled = false
}
chartView.data = data
setMarkViewData()
}
func setMarkViewData() {
let marker = MonitorSeachDetailMarkerView.init(insets: UIEdgeInsets(top: 10, left: 10, bottom: 10, right: 10))
chartView.marker = marker
marker.chartView = chartView
marker.modelData = self.chartModelData
marker.setNeedsDisplay(marker.bounds)
}
func getWidthWithTitle(title:String,font:UIFont) -> CGFloat {
let label = UILabel.init(frame: CGRect(x: 0, y: 0, width: 1000, height: 0))
label.text = title
label.font = font
label.sizeToFit()
return label.frame.size.width
}
func generateLineData(model:MonitorSeachDetailModel,count:Int) -> LineChartDataSet {
var entries = [ChartDataEntry]()
for (i, dd) in model.dateData.enumerated() {
if let dex = chartModelData?.totalDateArr.firstIndex(of: dd){
let entrie = ChartDataEntry(x: Double(dex), y: Double(model.valueData[i]) ?? 0.0)
entries.append(entrie)
}
}
var name = ""
if self.chartModelData?.barCount ?? 0 > 1 {
name.append("【左轴】")
}else{
if self.chartModelData?.MonitorSeachDetailModelList.count ?? 1 > 1 {
let relay:String = (count == 1 ? "【右轴】" : "【左轴】")
name.append(relay)
}
}
name.append(model.title)
if !model.unit.isEmpty {
name.append("(" + model.unit + ")")
}
let set = LineChartDataSet(entries: entries, label: name)
set.setColor(UIColor.init(hex: model.color))
set.lineWidth = 2.5
set.setCircleColor(UIColor.clear)
set.circleRadius = 0
set.circleHoleRadius = 0
set.fillColor = UIColor.clear
set.mode = .linear
set.drawValuesEnabled = false
set.drawHorizontalHighlightIndicatorEnabled = false;
set.highlightColor = .gray
let randomColor = UIColor.init(hex: model.color)
let gradientColors = [randomColor.alpha(0.0).cgColor,
randomColor.alpha(0.7).cgColor]
let gradient = CGGradient(colorsSpace: nil, colors: gradientColors as CFArray, locations: nil)!
set.fill = LinearGradientFill.init(gradient: gradient, angle: 90)
set.drawFilledEnabled = true
// if self.chartModelData?.barCount ?? 0 > 1 {
// set.axisDependency = .left
// }else{
if count == 1 {
set.axisDependency = .right
}else{
set.axisDependency = .left
}
// }
return set
}
func generateBarData(model:MonitorSeachDetailModel,count:Int) -> BarChartDataSet {
var entries = [BarChartDataEntry]()
for (i,dd) in chartModelData!.totalDateArr.enumerated() {
if let dex = model.dateData.firstIndex(of: dd){
let entrie = BarChartDataEntry(x: Double(i), y: Double(model.valueData[dex])!)
entries.append(entrie)
}else{
let entrie = BarChartDataEntry(x: Double(i), y: 0)
entries.append(entrie)
}
}
var name = ""
if self.chartModelData?.barCount ?? 0 > 1 {
name.append("【左轴】")
}else{
if self.chartModelData?.MonitorSeachDetailModelList.count ?? 1 > 1 {
let relay:String = (count == 1 ? "【右轴】" : "【左轴】")
name.append(relay)
}
}
name.append(model.title)
if !model.unit.isEmpty {
name.append("(" + model.unit + ")")
}
let set = BarChartDataSet(entries: entries, label: name)
set.setColor(UIColor.init(hex: model.color))
set.drawValuesEnabled = false
// if self.chartModelData?.barCount ?? 0 > 1 {
// set.axisDependency = .left
// }else{
if count == 1 {
set.axisDependency = .right
}else{
set.axisDependency = .left
}
// }
return set
}
}
在 2021-09-23 14:16:39,"lumm" ***@***.***> 写道:
这个问题怎么解决的?
贴下你的代码
—
You are receiving this because you commented.
Reply to this email directly, view it on GitHub, or unsubscribe.
Triage notifications on the go with GitHub Mobile for iOS or Android.
|
|
设置下 chartView.extraBottomOffset 试试 |
|
leftAxis.axisMinimum = 0.0
rightAxis.axisMinimum = 0.0
搞定
在 2021-09-23 14:48:41,"lumm" ***@***.***> 写道:
设置下 chartView.extraBottomOffset 试试
—
You are receiving this because you commented.
Reply to this email directly, view it on GitHub, or unsubscribe.
Triage notifications on the go with GitHub Mobile for iOS or Android.
|
Sign up for free
to join this conversation on GitHub.
Already have an account?
Sign in to comment

设置的代码和效果如图:求大神指教~The text was updated successfully, but these errors were encountered: