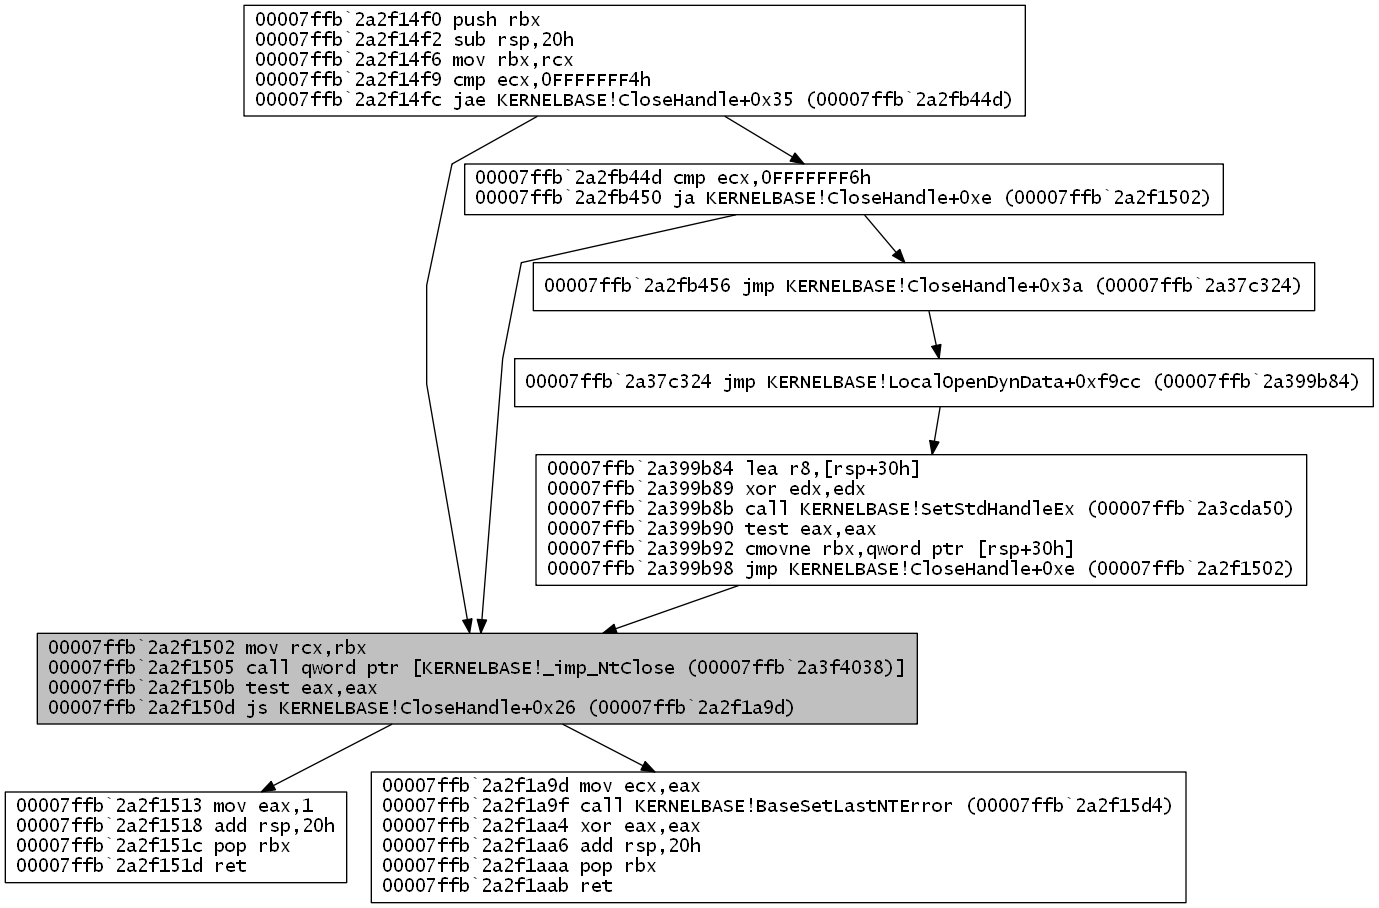
ufgraph.py is a simple script which parses the output of the uf (un-assemble function) command in windbg and uses graphviz to generate a control flow graph as a PNG/SVG/PDF/GIF (see -of option) and displays it
Please note, that some additional options (eg: /c) to the uf command are not supported and will likely break the output parsing or graph rendering.
- Python 2.7
- Graphviz
- http://www.graphviz.org/Download.php
- make sure the binaries are in your %PATH%
- graphviz python package (optional, but more stable)
- https://pypi.python.org/pypi/graphviz
pip install graphviz
From within windbg, simply run the script using the .shell command as follows:
.shell -ci "uf ntdll!rtlinsertentryhashtable" c:\python27\python.exe ufgraph.py
It is also possible to build a call graph at your current instruction pointer (EIP/RIP) and have ufgraph highlight the this basic block as follows:
.shell -ci "r $ip; uf $ip" c:\python27\python.exe ufgraph.py
It is also possible to output multiple call graphs for each frame in the call stack as follows:
.shell -ci "!for_each_frame \"r $scopeip; uf $scopeip\"" python.exe ufgraph.py -sh

