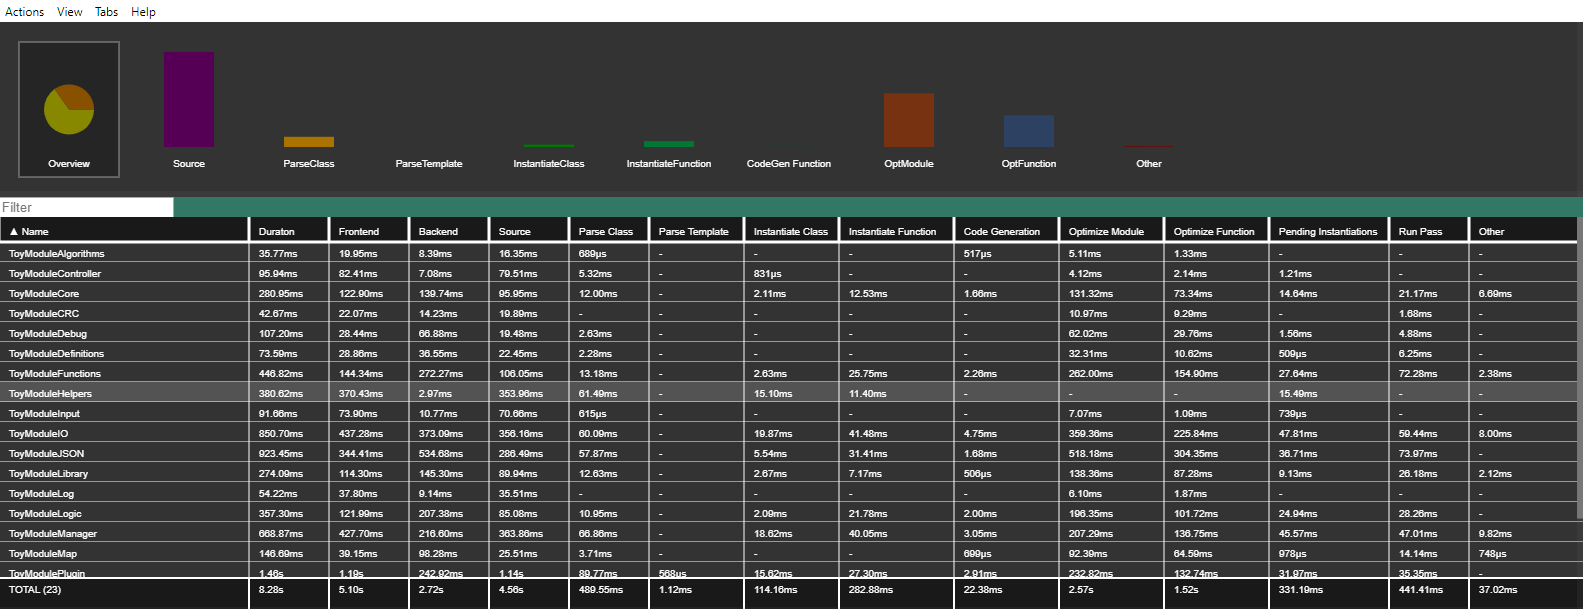
Visual C/C++ Profiler for Clang 9 or higher. Using the flag -ftime-trace (see Clang 9 release notes) Clang will create a time report (.json) next to the generated .obj file. Within See++ Compiler Profiler multiple reports can be aggregated in one single view, giving valuable information at a project scale.
It will help identify and track how includes, templates, function instantiations, etc. perform inside the compiler, being able to pinpoint the most expensive ones (or anything of particular interest, really).
Get Latest Linux (Not tested)
Get Latest MacOS (Not tested)
Drag or open the folders and files to be inspected. All the files will be parsed (this can take some time if the project is really big) and the overview window will show up with a full recap for all translation units found.
The graphs on top can be used to switch between the different categories in order to visualize more specific data.
Any row can be double-clicked to visualize the actual timeline for the given translation unit or for the translation unit that contains the worst offender (for source, class, function...).
(use Ctrl+MouseWheel for zoom in/out)
First of all node.js needs to be installed.
Make sure the commands are run inside the SeeProfiler subfolder:
cd SeeProfiler
Install the project dependencies:
npm install
Run the application:
npm start
Alternatively the App can be launched within Visual Studio Code.
To export the project as a standalone application:
npm run export
- See++ Compiler Profiler is based on Electron.

