Make 0.6 GeV Default pT Cut #397
Conversation
|
/run standalone |
|
I did not remember during the meeting that there was no toggle to go to 0.6 from 0.8. Perhaps we can first test what @VourMa proposed, to check if 0.6 GeV bin files can be used safely (no physics change and no significant slowdown) with the old default 0.8 GeV. |
|
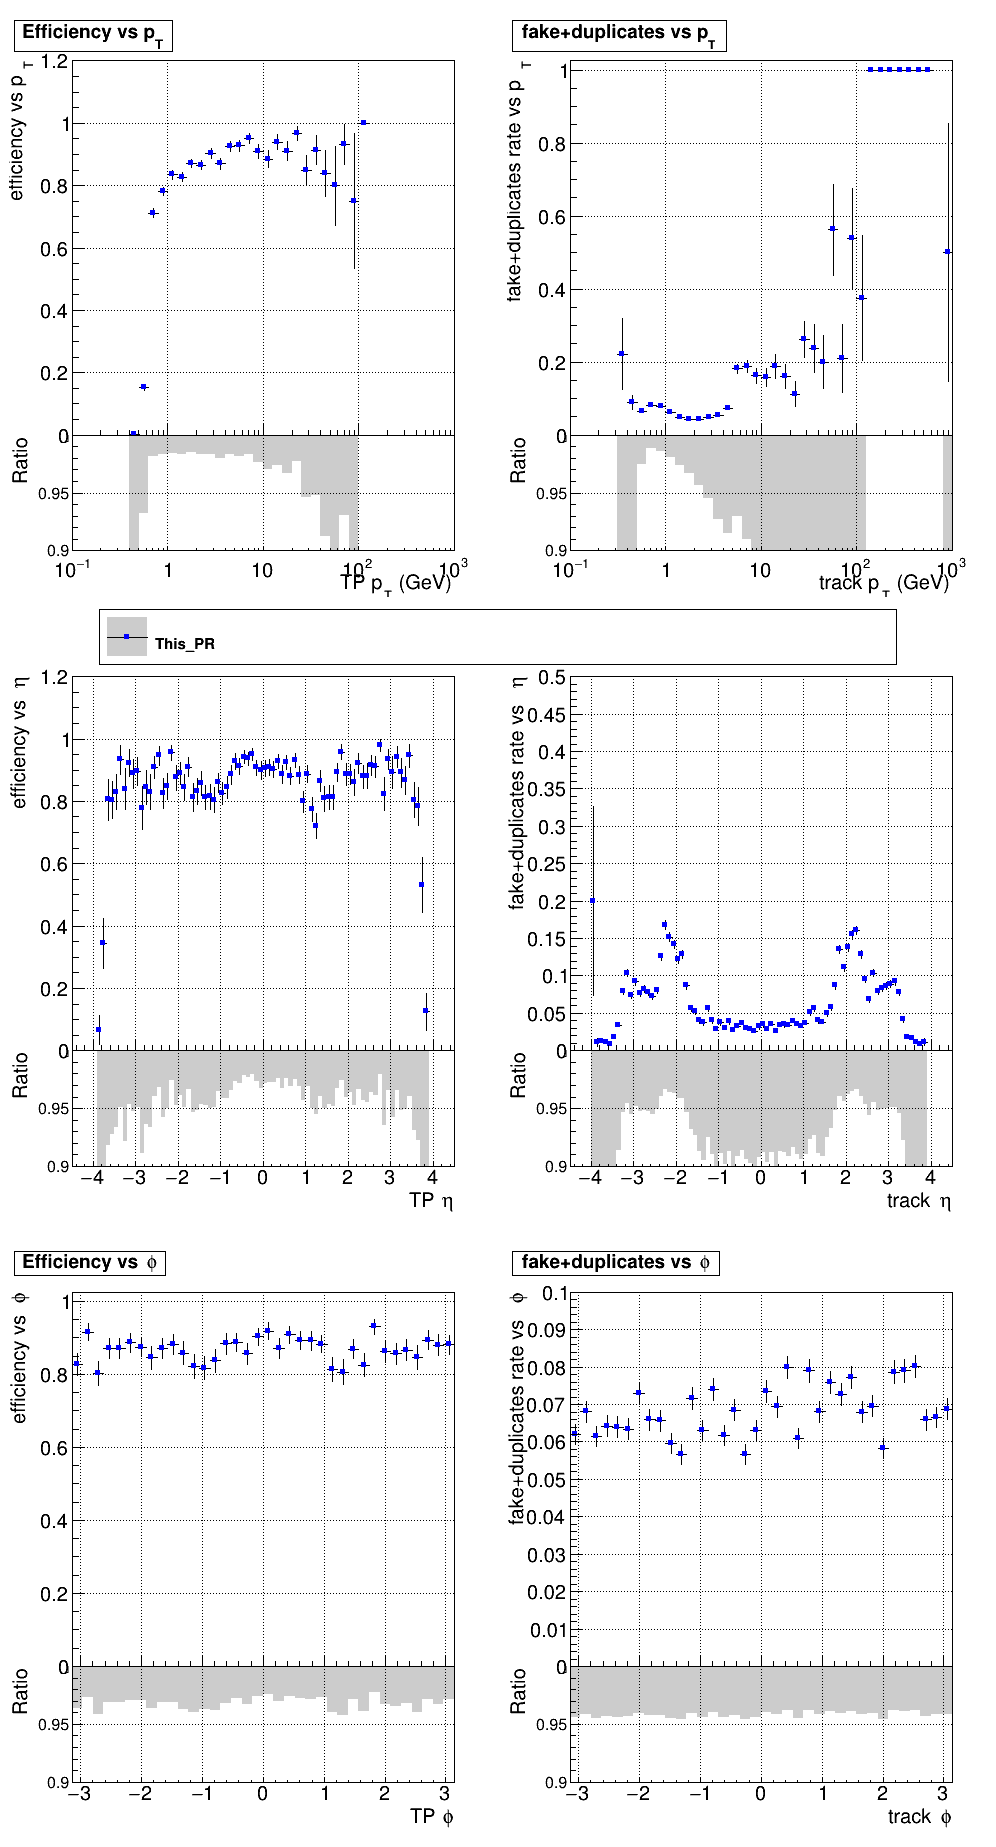
The PR was built and ran successfully in standalone mode. Here are some of the comparison plots.
The full set of validation and comparison plots can be found here. Here is a timing comparison: |
Sure, sounds like a good check. I'll make another commit after the CI finishes running and rerun the CI with only the files changed. |
|
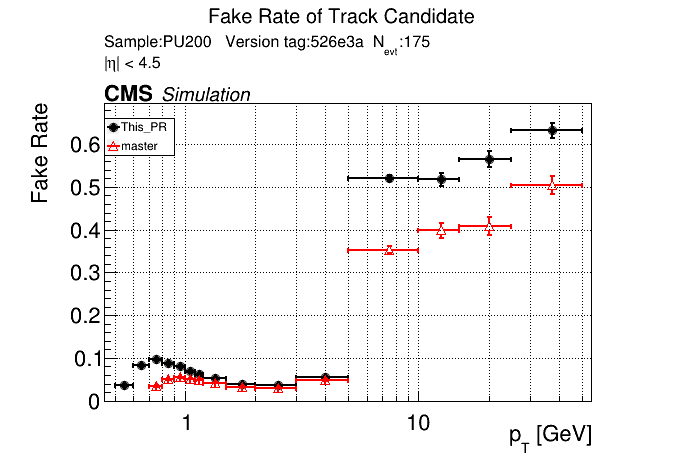
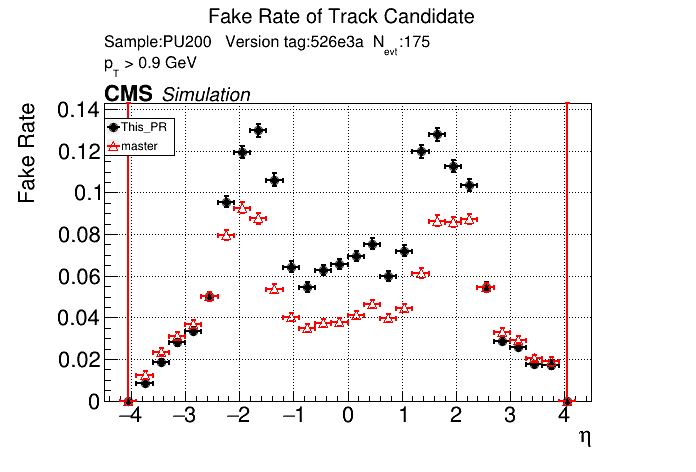
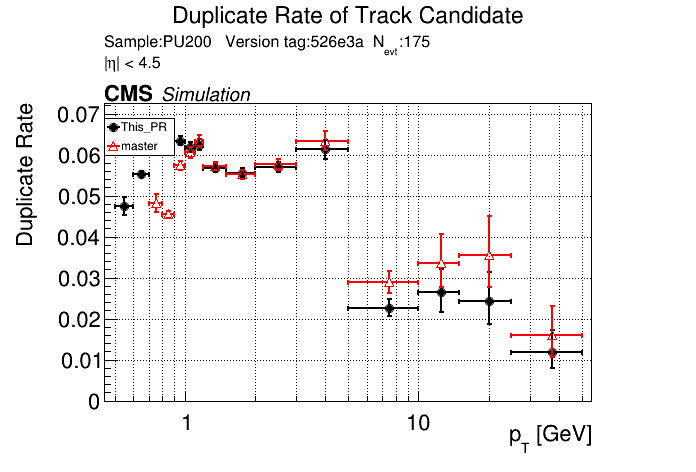
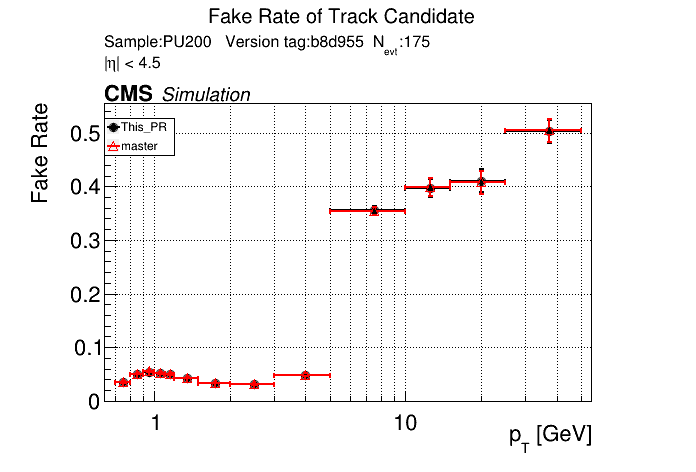
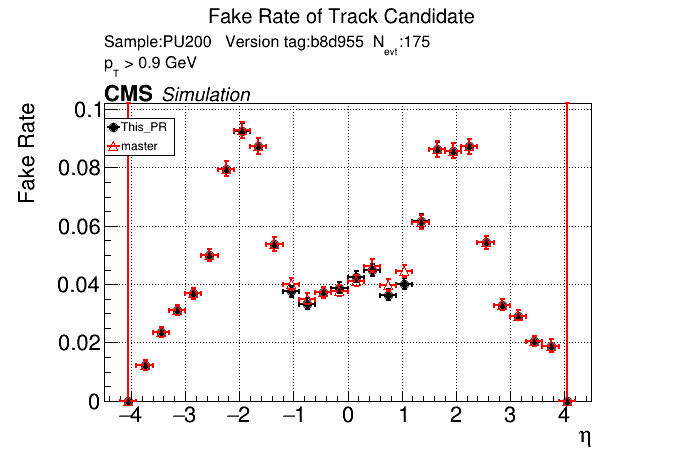
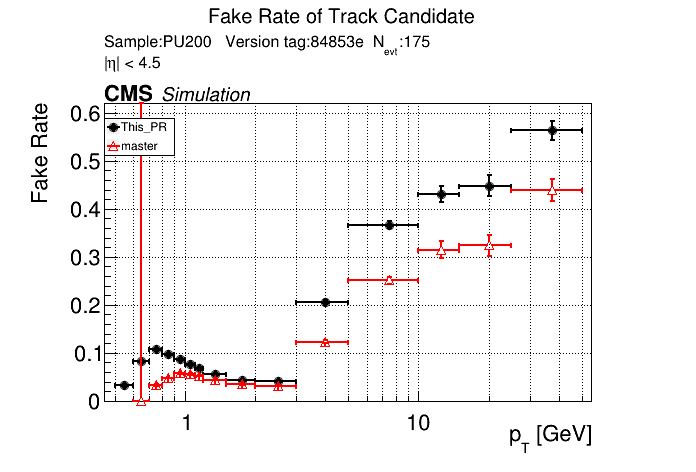
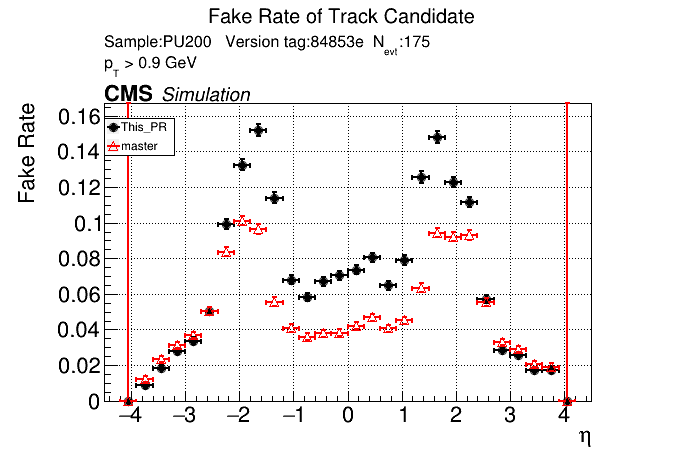
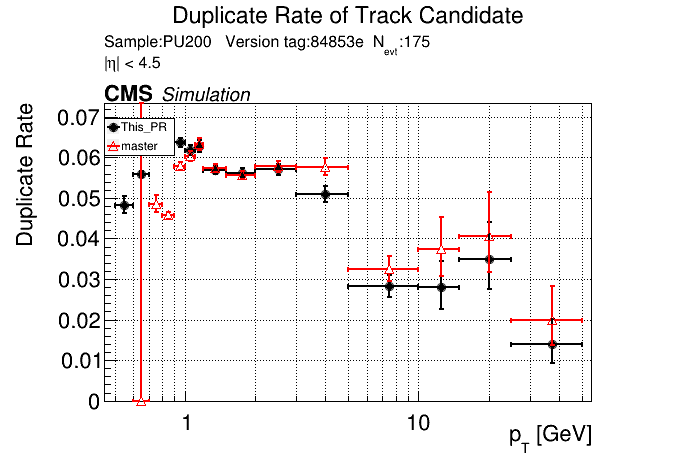
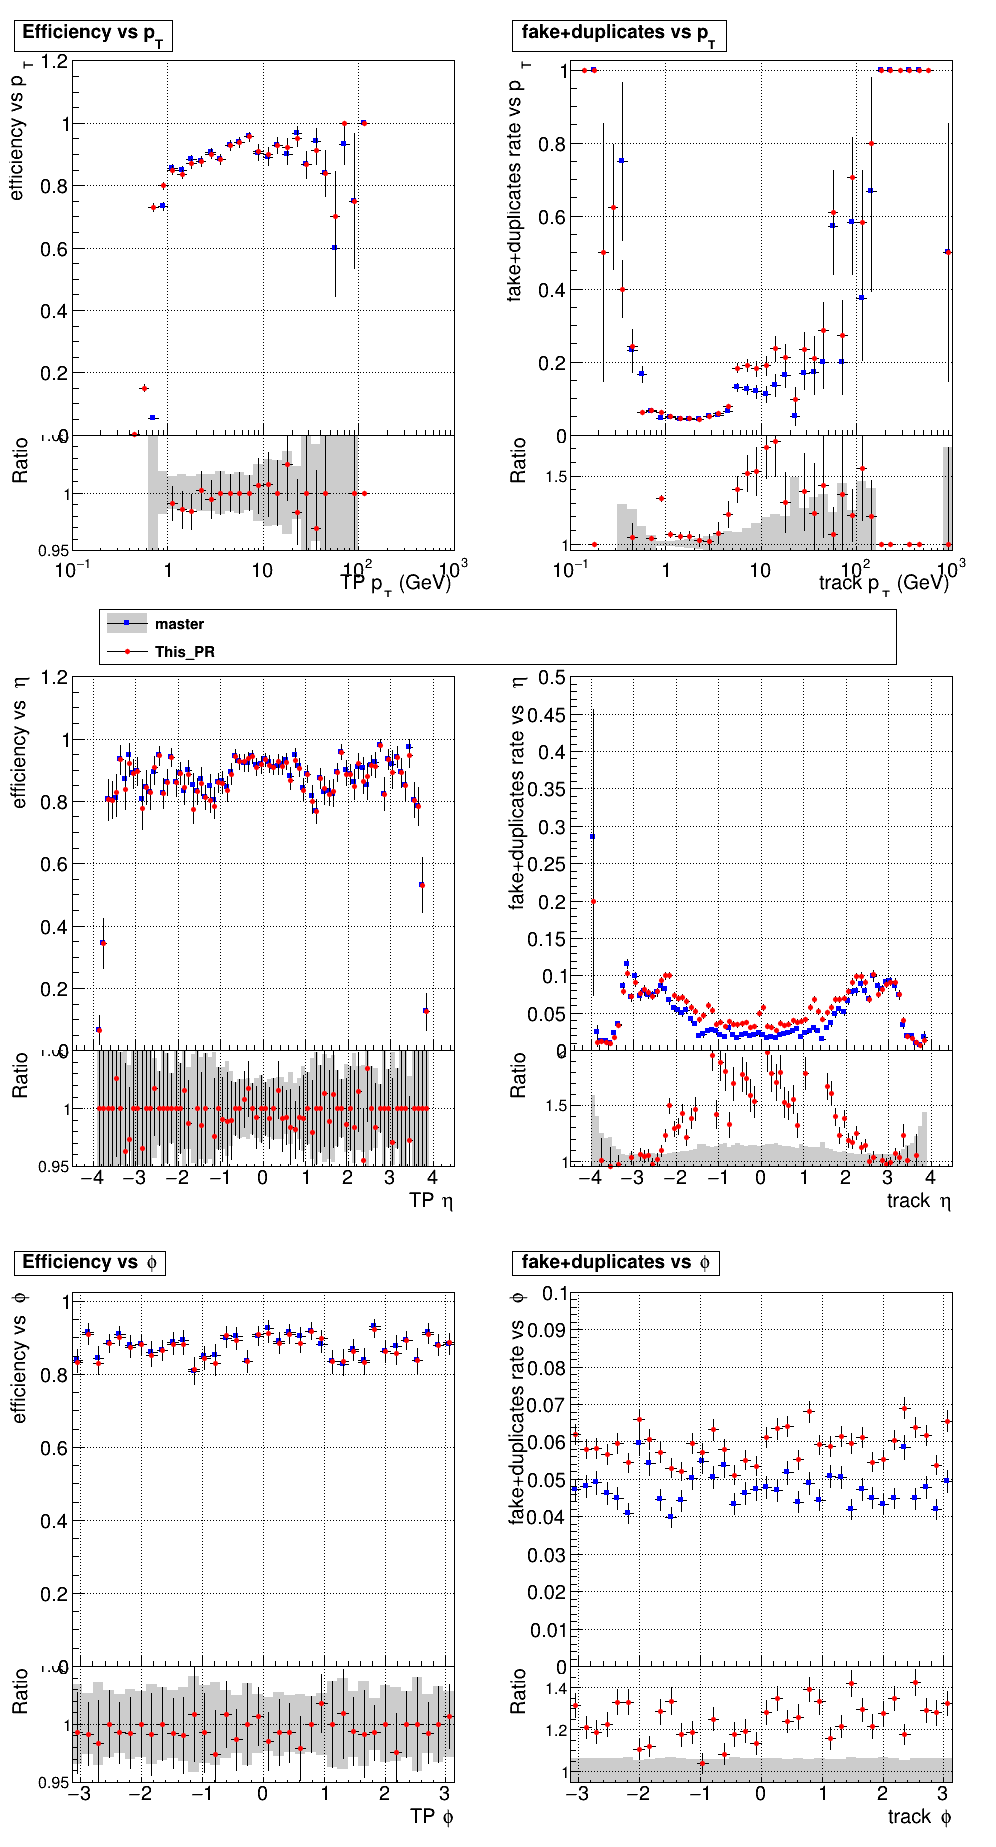
this confirms that fakes are not localized to pt<0.8 GeV. The effect is apparently from the |
|
Yes, that's what I saw before. pT3's contribute most to the fakerate increase at high pT. 
|
indeed. |

|
There was a problem while building and running with CMSSW. The logs can be found here. |
|
/run standalone |
|
The PR was built and ran successfully in standalone mode. Here are some of the comparison plots.
The full set of validation and comparison plots can be found here. Here is a timing comparison: |

I just updated the CI to use the new version of CMSSW. @GNiendorf I'll restart the cmssw check.
I did it this way to keep the size of the archive as small as possible. You could look at the commit history, and check the breakdown plots of the previous PR. But if there's strong reasons to keep both PR and master for each PR I'm happy to implement that. |
Oh yeah fair point. |
|
The PR was built and ran successfully with CMSSW. Here are some plots. OOTB All Tracks
The full set of validation and comparison plots can be found here. |
|
@slava77 Timing with 0.6 Maps Current Master |


|
/run CMSSW |
|
There was a problem while building and running with CMSSW. The logs can be found here. |
From this may need some manual debugging. It looks like the 0.6 GeV maps are mostly OK; the CPU variant LS kernel is apparently slower (it's less visible/significant in the GPU case) |
@GNiendorf |
|
@GNiendorf yeah, I'll take a look |
|
I opened a PR to fix the issue in SegmentLinking/cmssw#24. Also, looking at the logs you see that for one of the events you get this warning: So it seems like it's pretty close to the edge and it might be worth increasing that a bit. I'll run the CI with the above PR to make sure that it works. /run cmssw 24 |
|
The PR was built and ran successfully with CMSSW. Here are some plots. OOTB All Tracks
The full set of validation and comparison plots can be found here. |
@ariostas please remind me why the reference is not shown in TrackLooper+cmssw PR test? Can we show the master as is as a reference? |
|
Currently it doesn't do the comparison if using a PR or a different branch, but yeah I should change it so that it does the comparison as long as the cmssw version is the same. |
|
/run standalone |
SDL/Quintuplet.h
Outdated
| else if (category_number == 0 && eta_number == 1) | ||
| occupancy = 414; | ||
| occupancy = 86; |
There was a problem hiding this comment.
are these numbers lower due to a more restrictive target?
We had 99.99% for T5; 99.9% for T3; 99% for segments, 99.99% for minidoublets.
|
The PR was built and ran successfully in standalone mode. Here are some of the comparison plots.
The full set of validation and comparison plots can be found here. Here is a timing comparison: |


|
It seems like the T5 occupancies were set incredibly high. @YonsiG Do you know what percent they were set to? Even at 99.99% I find that the low pT occupancies are lower than the current occupancies. |
|
@GNiendorf |
I changed it to only consider non-zero occupancies. |
|
/run standalone |
|
The PR was built and ran successfully in standalone mode. Here are some of the comparison plots.
The full set of validation and comparison plots can be found here. Here is a timing comparison: |

|
The PR was built and ran successfully with CMSSW. Here are some plots. OOTB All Tracks
The full set of validation and comparison plots can be found here. |
|
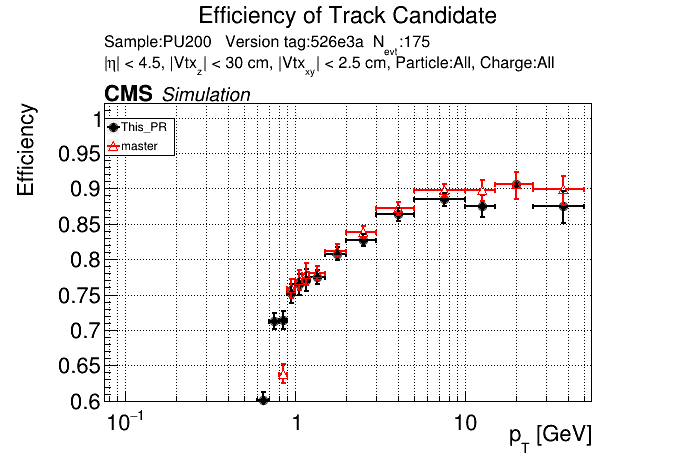
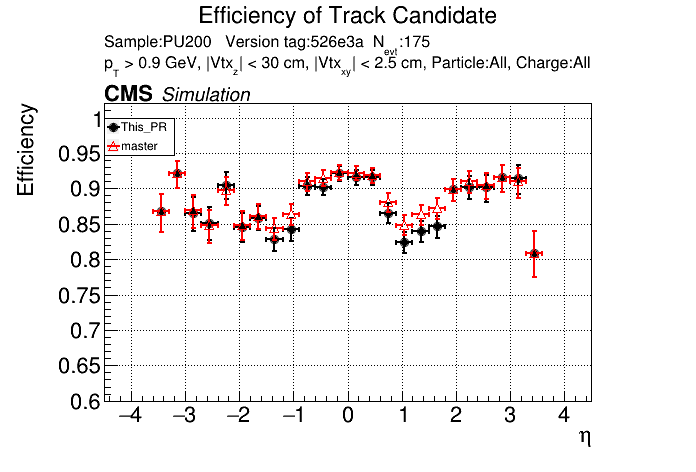
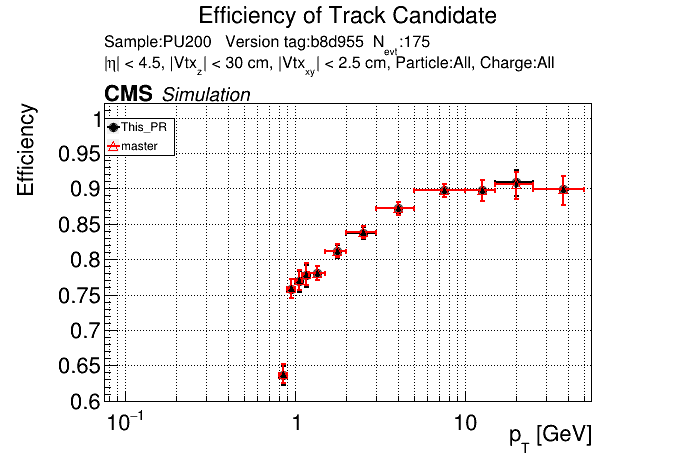
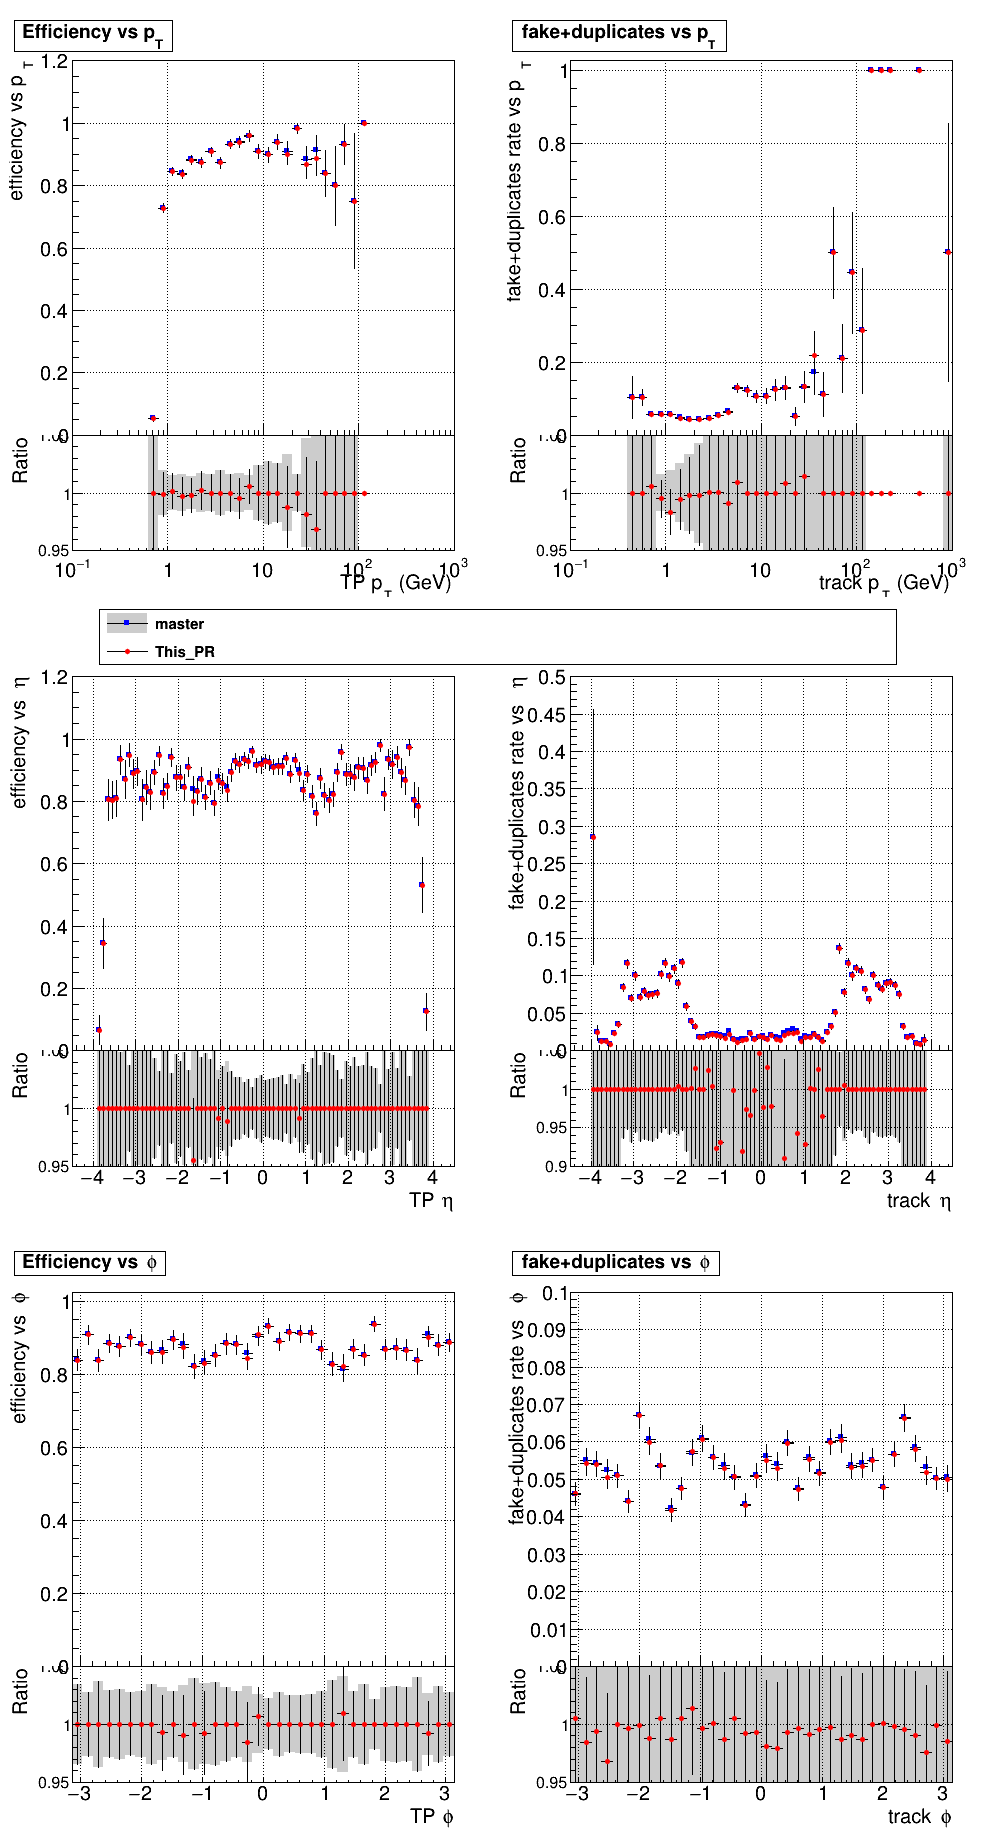
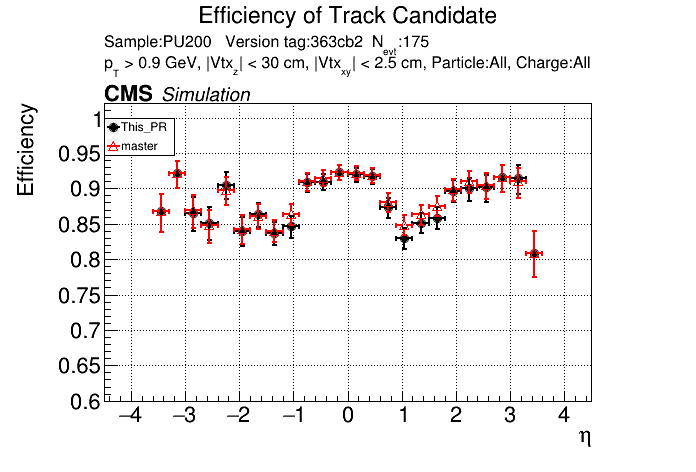
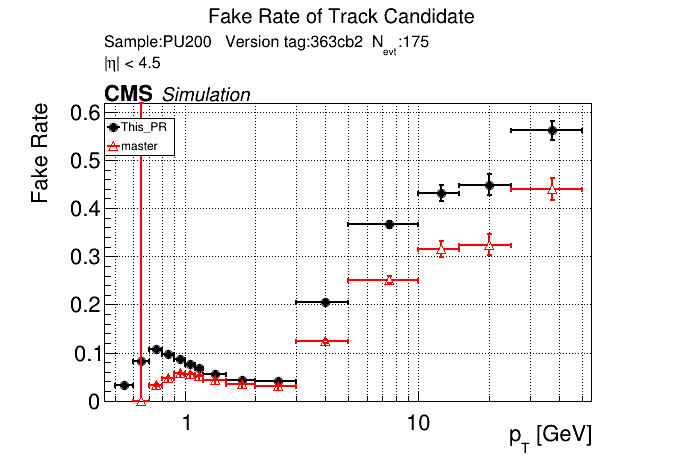
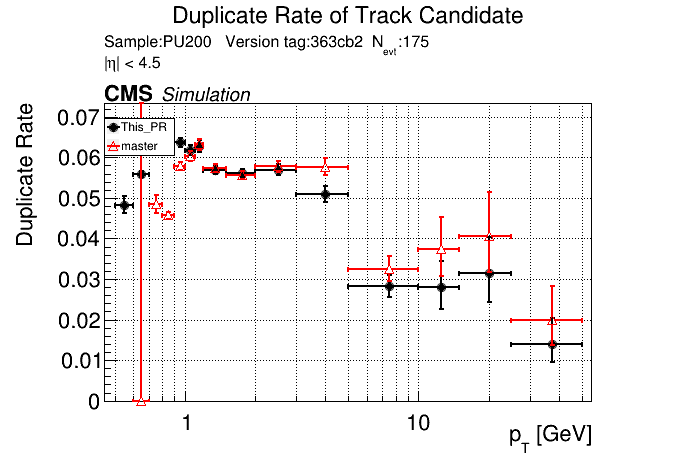
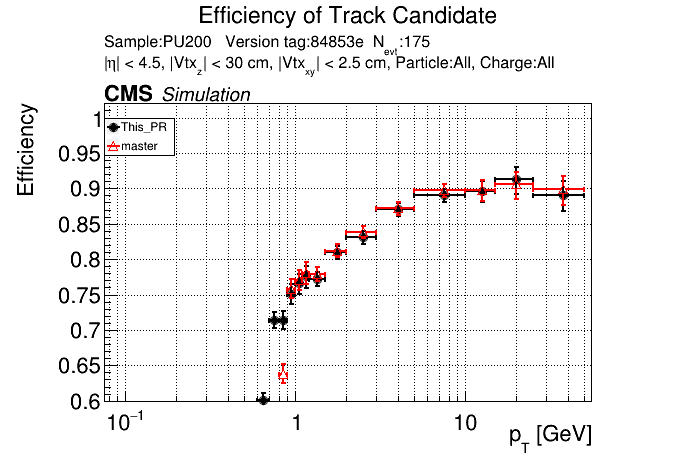
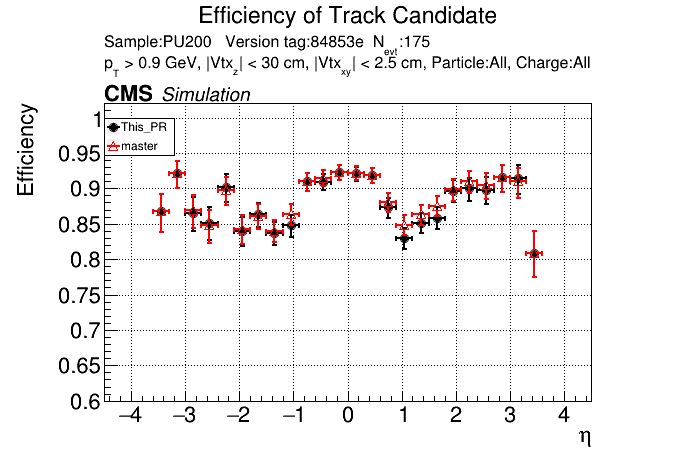
Plots for 1000 events: https://www.classe.cornell.edu/~gsn27/www/www/PRlowpT/ Seems like the efficiency difference is pretty minimal now at high pT @slava77 


|
| else if (category_number == 1 && eta_number == 1) | ||
| occupancy = 128; | ||
| occupancy = 653; |
There was a problem hiding this comment.
some updates are going up quite a bit, like here. On the other hand some others like in T5 https://github.com/SegmentLinking/TrackLooper/pull/397/files#diff-d9d3d7c519ab64f27b6e501281a0eb282be964d2802ddca40387348a68bb6cb0R3182 are going down
Cat1 is layers 4,5,6. It looks like something like layer 6 or even 5 already opens up a lot.
On one hand, an additional category may be useful.
On the other, it would be good to see some plots of the segment angles (is it phi change): there was a discussion to truncate this so that it doesn't hit pi/2 or even larger.
There was a problem hiding this comment.
Cat1 is layers 4,5,6. It looks like something like layer 6 or even 5 already opens up a lot.
given this is a segment; the possible layers are 4 and 5.
|
@GNiendorf |
|
|
is this 1K events? |
Yes, from PU200RelVal |
|
If I increase the occupancies by 10x from where they are in this PR, I get the following: 
So it seems like the efficiency at high pT is recovered fully if you put the occupancies high enough. |
if the increase goes far above what we have in the master, it could be that what we observe is in part just a recovery of the inefficiency brought in by truncation initially. How does master compare with just the increase of the occupancy cutoffs (without the change in the pt cut)? |
|
If I just increase the occupancies on master by 10x I get the following.
|

|
This PR Timing Master Timing Max Memory Usage, Master (L40, 175 events, 8 streams, caching allocator on) Max Memory Usage, This PR (same setup) |


|
Does How well is the caching allocator shared between modules of the same process? What is happening in case of multiple processes? I think that we can expect between 8 and 16 thread jobs populating a 256-core node with at best 2 cards. So, from 8 to as many as 32 (or more?) processes will talk to the same card. @dan131riley |
|
48GB for the L40 is correct, but the CUDA device driver allocates some of that. We actually see the same thing on the host system specs, max available mem is always less that the actual physical mem. The caching allocator works a lot like malloc(). Within a process, memory available to the caching allocator is shared between modules so long as modules free caching allocator memory in a timely fashion. Memory allocated by one process is held onto by the caching allocator, so isn't normally available to other processes. I don't remember offhand if there is a call to force releasing caching allocator memory--if there is, I wouldn't expect it to be very effective because the caching allocator is likely to fragment its address space. Last I heard I thought the preferred operating mode with GPUs (at least for HLT) was one process per socket with a GPU bound to each socket. I don't know how that's expected to scale up to 96 cores per socket, but I can't imagine it going well. Nvidia does have the "CUDA Multi Process Service management" (MPS) for sharing GPU resources between processes--I've used it in the past for benchmarking, but not recently. I don't know if it figures in the HLT plans, and Nvidia seems to keep tweaking how it works with each new architecture generation. |
Ah, indeed, it's not 8 or 16 threads. |
|
Closing, see new PR: SegmentLinking/cmssw#39 |
PR for discussion of moving the current pT cut from 0.8 to 0.6 GeV.