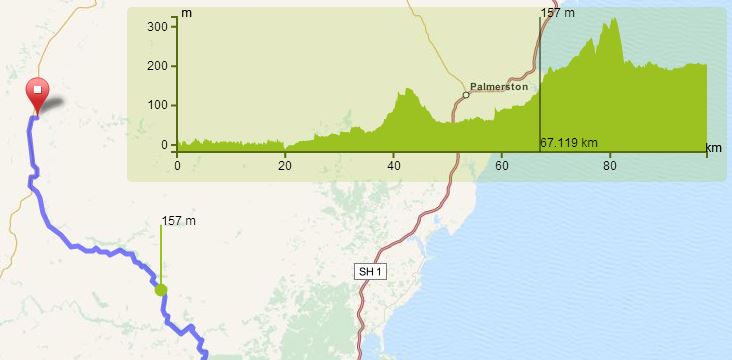
A Leaflet plugin to view an interactive height profile of polylines lines using d3. This plugin is under development.
Supported and tested Browsers:
- Chrome
- Firefox
- IE 10+
Supported data:
- GeoJSON Demo
- GPX-files using leaflet-gpx Demo
Tested with Leaflet 0.4+
npm install leaflet.elevation
bower install leaflet.elevation
Altitude information for each point is necessary in the given data.
//all used options are the default values
var el = L.control.elevation({
  	position: "topright",
	theme: "steelblue-theme", //default: lime-theme
	width: 600,
	height: 125,
	margins: {
		top: 10,
		right: 20,
		bottom: 30,
		left: 50
	},
	useHeightIndicator: true, //if false a marker is drawn at map position
	interpolation: d3.curveLinear, //see https://github.com/d3/d3-shape/blob/master/README.md#area_curve
	hoverNumber: {
		decimalsX: 3, //decimals on distance (always in km)
		decimalsY: 0, //deciamls on hehttps://www.npmjs.com/package/leaflet.coordinatesight (always in m)
		formatter: undefined //custom formatter function may be injected
	},
	xTicks: undefined, //number of ticks in x axis, calculated by default according to width
	yTicks: undefined, //number of ticks on y axis, calculated by default according to height
	collapsed: false,  //collapsed mode, show chart on click or mouseover
	imperial: false    //display imperial units instead of metric
});
el.addTo(map);
L.geoJson(geojson,{
    onEachFeature: el.addData.bind(el) //working on a better solution
}).addTo(map);
var el = L.control.elevation();
el.addTo(map);
var g=new L.GPX("./mytrack.gpx", {async: true});
g.on("addline",function(e){
el.addData(e.line);
});
g.addTo(map);// reset data and display
el.clear();If you are new to grunt please refer to the quick start guide.
Install npm dependencies with
npm install
Run jasmine tests with
grunt test
And compile with
grunt
To generate different themes lessCSS is used. Create your own theme in a new .less file in src/css/themes. Usable variables are
@theme : lime-theme;
@base-color : #9CC222; //basecolor to derive other colors from
@highlight-color : #637E0B; //basecolor to derive selections from
@background : fade(@base-color,20%); //background-color
@drag-color : fade(@highlight-color,40%); //drag selection color
@axis-color : darken(@base-color,20%); //color of axes
@stroke-color : darken(@base-color,40%); //color for mouse highlight
@stroke-width-mouse-focus : 1; //stroke width for mouse highlight
@stroke-width-height-focus: 2; //stroke width for height focus indicator
@stroke-width-axis : 2; //stroke width for axes
@icon : 'images/elevation-lime.png'; //path to icon for collapsed button
Add the theme file to the less- and cssmin task in the Gruntfile and you´re good to go.