-
Notifications
You must be signed in to change notification settings - Fork 103
plotting
The first step in understanding a new tag format is to determine what modulation scheme it's using. This can best be done visually, as there are only three major branches of modulation that you will encounter, and they are visually very different. Namely:
- ASK - Amplitude Shift Keying, also known as OOK or On/Off Keying
- FSK - Frequency Shift Keying
- PSK - Phase Shift Keying
These formats are described in detail elsewhere [to be copied across from kickstarter], but for the purposes of initial recognition, they look like this:

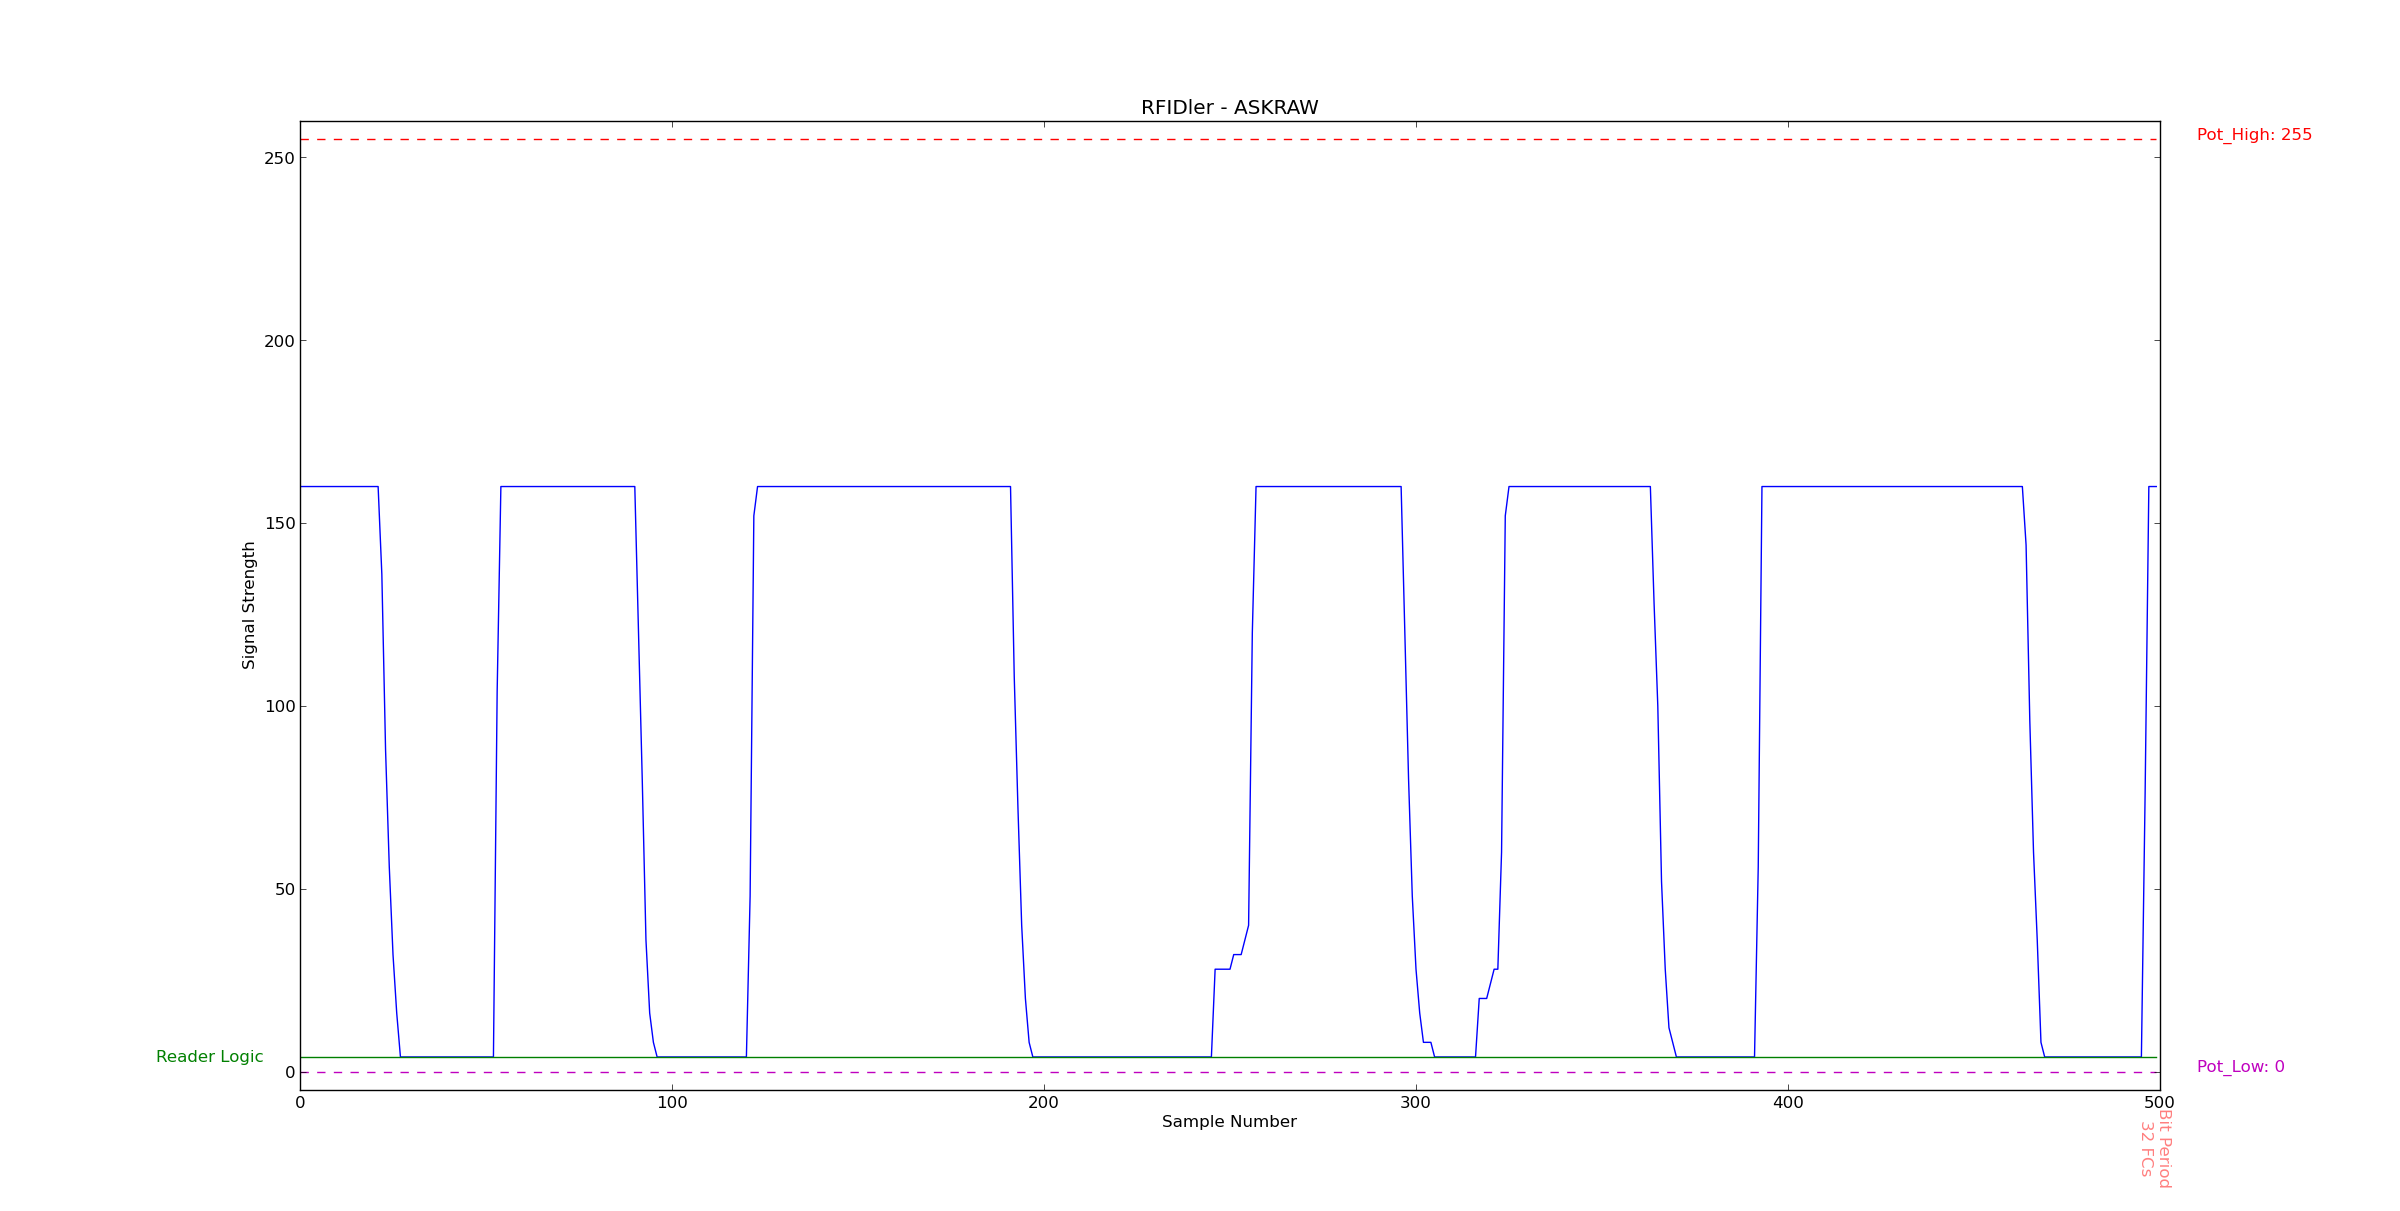
ASK has the appearance of a simple square wave. Sub-formats such as Manchester and Bi-Phase can be applied to ASK (and, indeed, any modulation scheme).

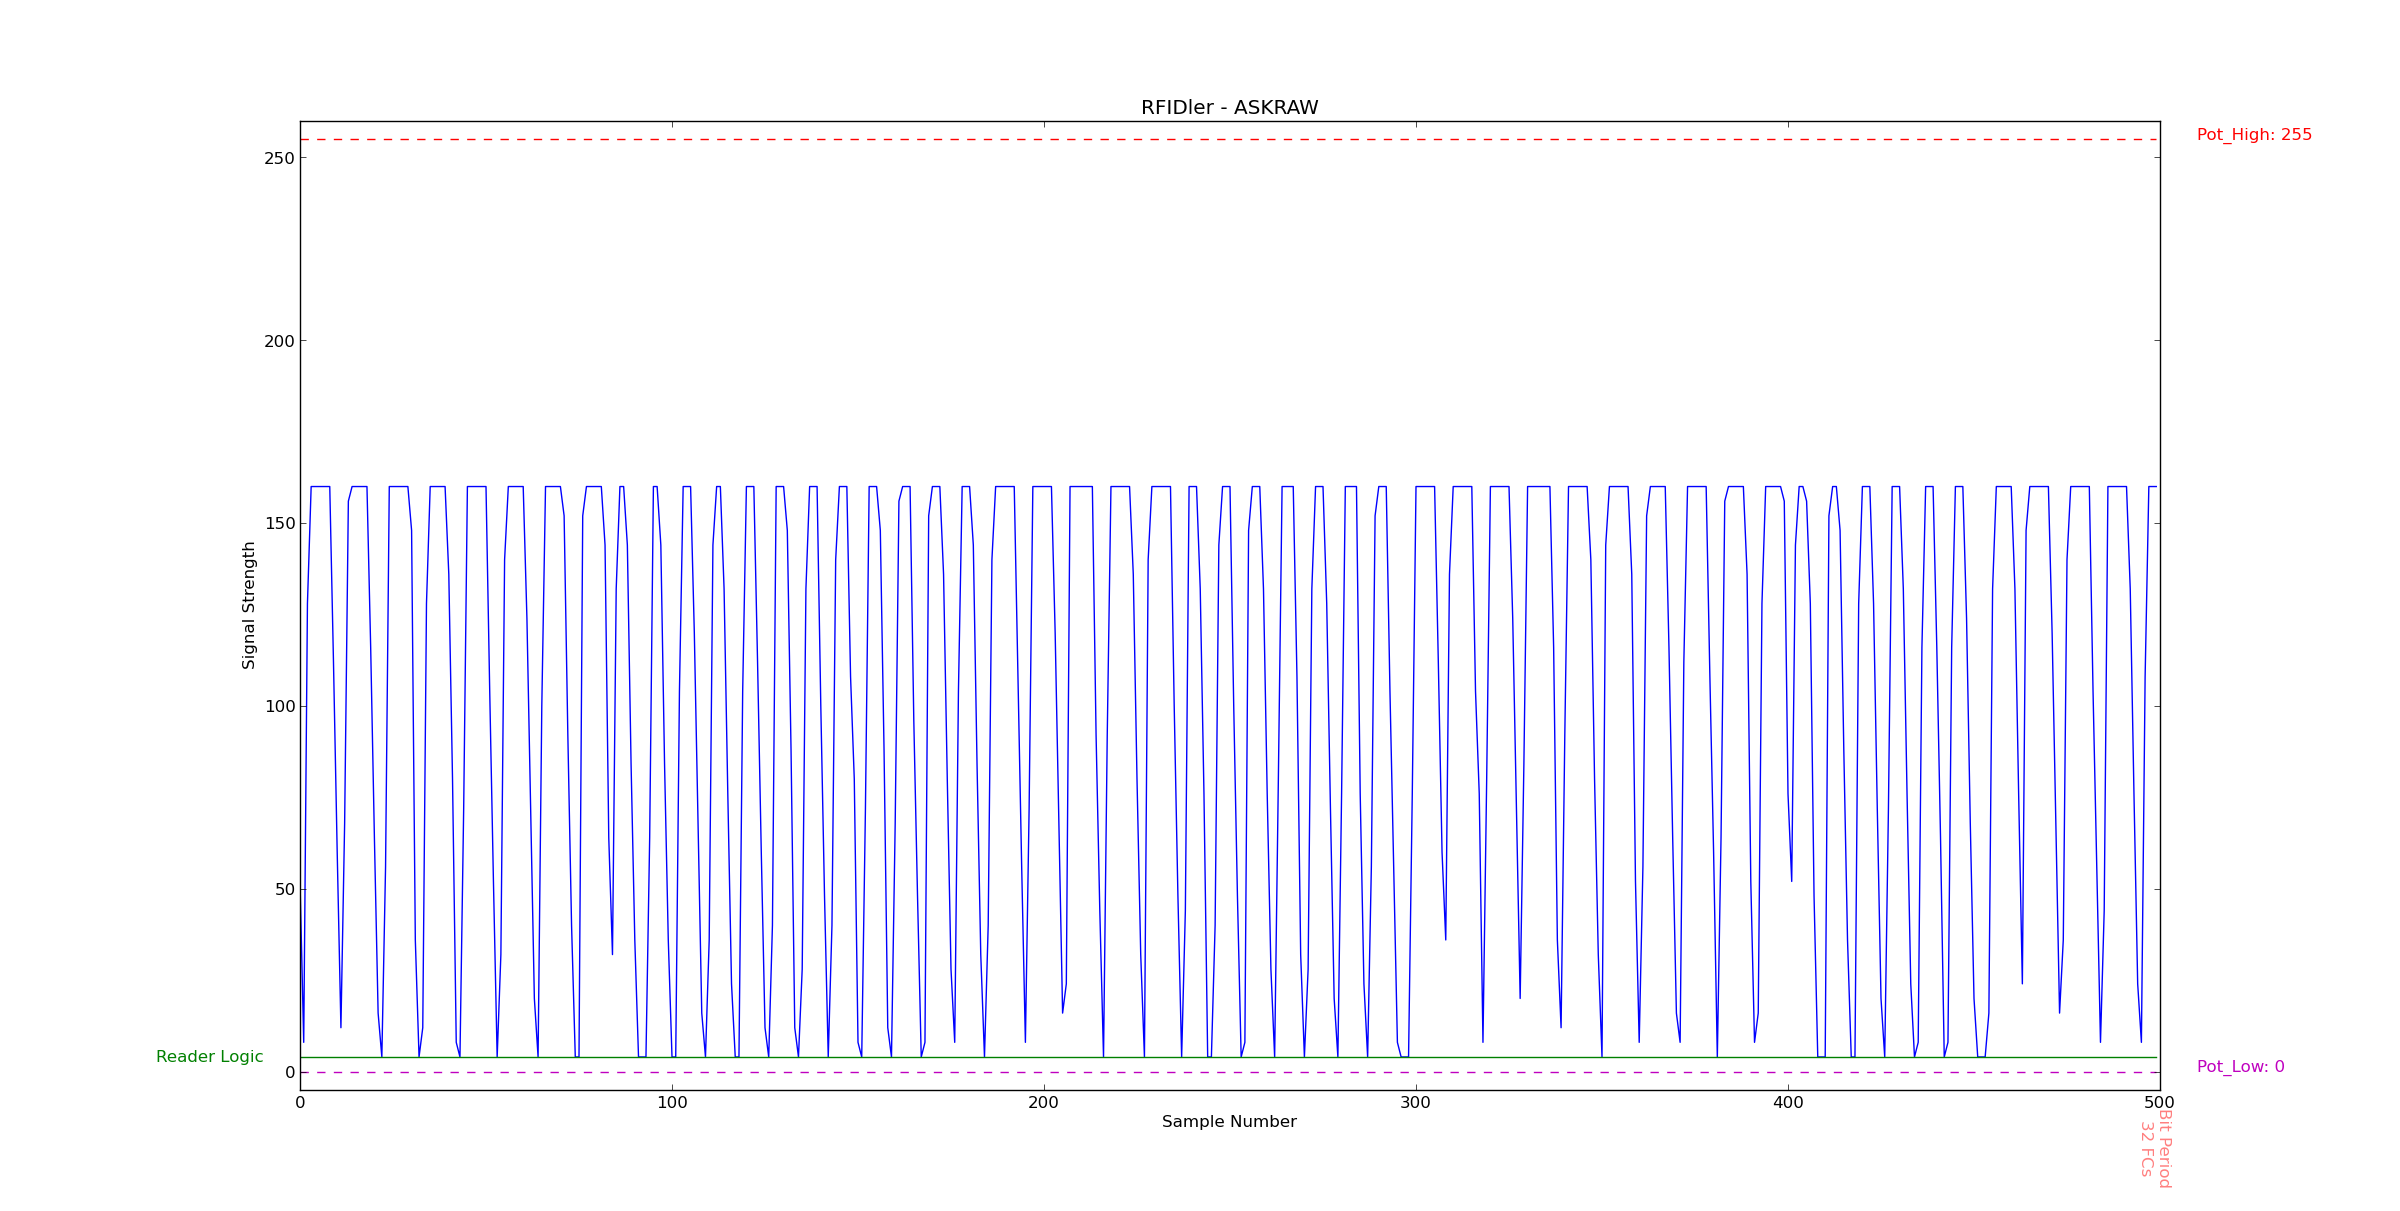
FSK distinguishes itself by having two different wave sizes, and peak counts. In this image, we can see the two central groups of 5 and 7 peaks, representing a 0 and a 1. The larger groups represent two or more of the same digit.

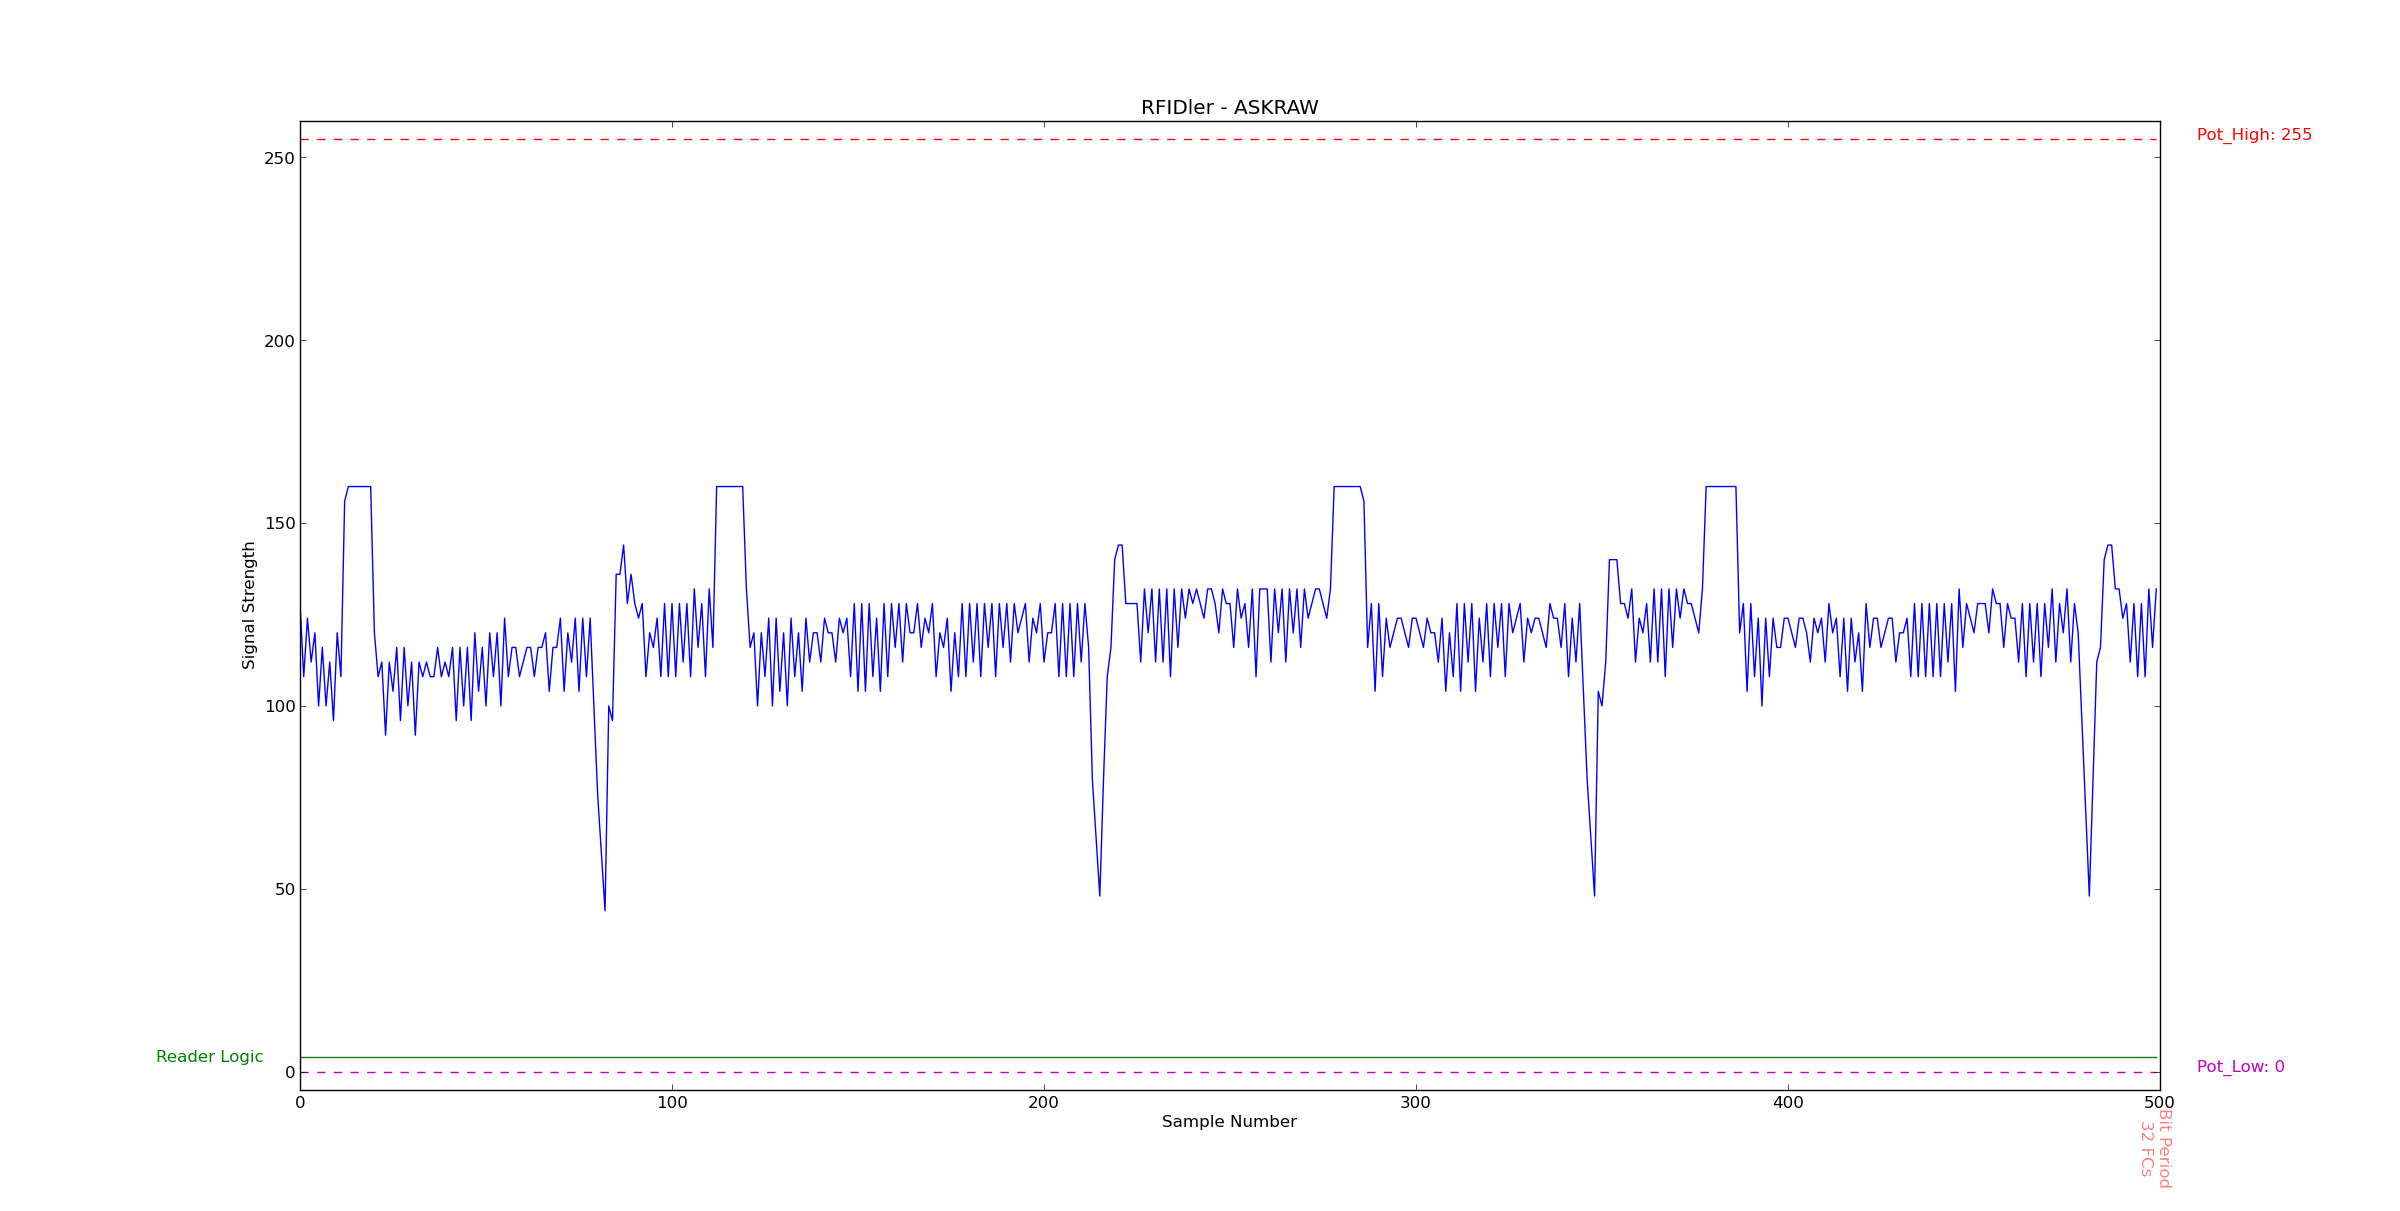
PSK has a central 'bar' of data, with individual spikes alternately issuing up or down.
That's it. Your tag should be one of these three.
For the purpose of this howto, we're going to look at an unknown tag and work through the process of figuring out how to read it "properly".
The first step is to produce a plot like the one above. To do this, we use the python helper app 'rfidler.py'. Regardless of what type of tag we think it is, we are going to tell RFIDler to read it as 'Raw ASK'. This is because all we are doing is energising the tag and capturing a waveform from the coil. We are not trying to interpret any data yet, so it doesn't matter what modulation scheme RFIDler thinks we're using.
The command is as follows:
rfidler.py /dev/RFIDler 'set tag askraw' 'potset h 255' plot 500
Which translates as 'set the tag to ASKRAW, set the High Potentiometer to max, and plot 500 samples.
Setting the High Pot prevents the digital logic circuit from detecting any data which would only clutter the plot at this stage, and 500 samples is plenty to see what it is we're dealing with.
So, placing our mystery tag on the coil, we get:

This is clearly ASK. We will determine later if it is also Manchester or Bi-Phase.
The next step is to determine the data rate or 'Bit Period'. RFIDler measures these in 'Field Clocks'. A Field Clock is a single cycle of the carrier that is energising the tag - usually 125KHz, so 1 second divided by 125,000 gives us 8 microseconds. A Field Clock is therefore 8us, but you don't really need to know that since everything is referenced in FCs, including most datasheets.
For now we can simply take a guess at a rate (we will add measuring tools in due course!), and see if it matches:
rfidler.py /dev/RFIDler 'set tag askraw' 'potset h 75' 'set rate 16' plot 2000
This time we've set the High Pot to somewhere near the middle of the spike in order to detect the data, as well as asking for a larger sample group so we have more data to check our bit period against:

This shows us some interesting things:
Firstly, the square waves come in only two sizes, one double the size of the other. This is indicative of Manchester or Bi-Phase encoding. The reason for this is explained in detail here [ADD KICKSTARTER CONTENT]. It's very hard to tell the two apart visually, but we can do so later when we move on to the data processing stage.
Secondly, as you can see, pink stripes have appeared. These show not only the bit period, but also exactly when the processor 'sees' them in relation to the waveform. In this case they are deliberately skewed to straddle the transition from HIGH to LOW or vice-versa, and this is done to ensure detection of that change (or lack of it), which might be missed if the start or end of the bit period was too close to the event.
Finally, a green line has also appeared, which shows the state of the Reader Logic. This shows that we are correctly detecting when there is a HIGH or a LOW signal.
Now for some analysis...
Note that the pink stripes are an exact match in size for the smallest of the two wave forms, but as we have determined that we are dealing with Manchester Encoded data, this means that we've set our bit period too small - it is only half a bit as a full Manchester Encoded bit will always contain a transition. We therefore need to try again with double the Bit Period:
rfidler.py /dev/RFIDler 'set tag askraw' 'potset h 75' 'set rate 32' plot 2000

Now we can see that the pink strip almost exactly overlays some of the pairs of smaller waveforms. For example, just to the left of the 500 sample mark. Also, most importantly, it does not go out of sync as we see the same effect on the far right at the 2000 sample mark.
That's it for this stage! We've determined:
- Modulation Scheme: ASK
- Sub-Modulation: Manchester/Bi-Phase
- Bit Period: FC * 32
For the next stage, we move on to data analysis using the RFIDler menu. [TO BE COMPLETED]
Now let's do the same for FSK and PSK...